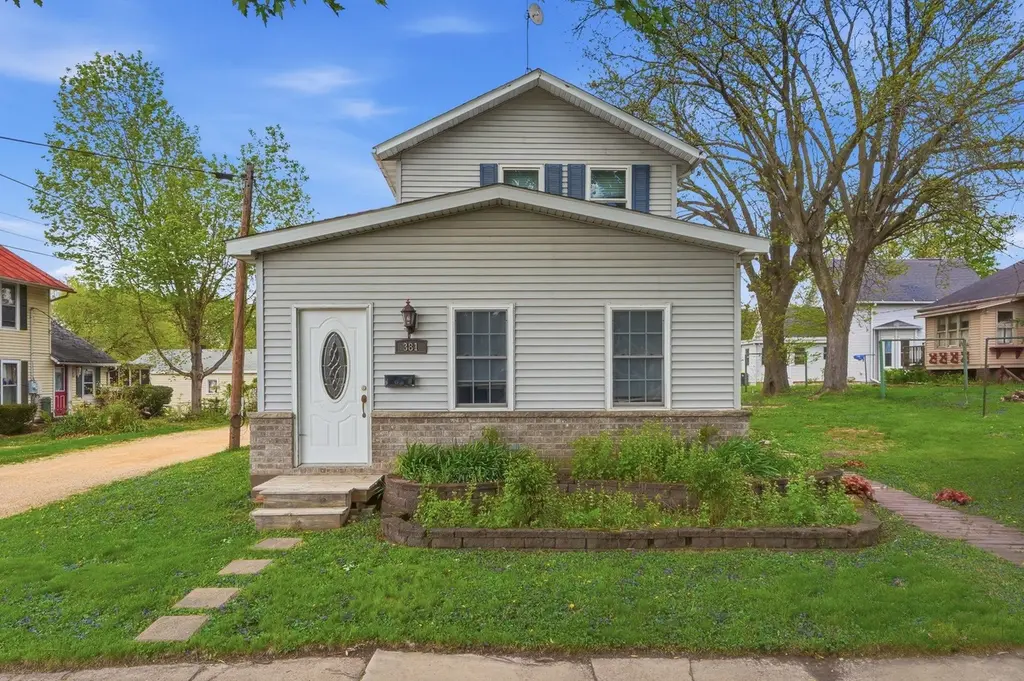
381 Sherwood Ave
East Dubuque, IL 61025
$134,000B-
3 bd · 1.0 ba ·
1,488 sqft ·
Built 1957
· Other
· Active
· 34 DOM
Cashflow @ list (25.0% down · 7.5%)
Estimated rent
$1,750/mo
Mortgage (P&I)
−$703
Tax + insurance
−$320
HOA
−$0
Vac / Maint / Mgmt
−$368
Net cashflow
$359/mo
Annual
$4,311/yr
Cap rate
9.51%
Cash-on-cash
11.49%
DSCR
1.51
1% rule
1.31%
Cash to close
$37,520
Investor read
- This is a 3-bed/1.0-bath other listed at $134k.
- At list price, monthly cash flow is $359 ($4k/yr) — positive.
- The deal already cash-flows at list — no discount required.
- Meets the 1% rule at list price ($2k rent vs $134k).
- It's been on market 34 days — a 3% lower offer ($130k) is reasonable based on typical stale-listing flexibility.
- Recommended offer: $130k (3.0% below list) — sets the bar for market timing.
- Local home prices are declining (-3.0%/yr); year-one equity from $926 of loan paydown is wiped out by about $4k of value loss. Plan a longer hold.
- Location reads 71/100 on livability (#349 in IL) — a middle-class / working-renter tenant base. Strengths: crime A+, cost of living A+, housing A+; Watch: health & safety C-, amenities F, commute F.
- East Dubuque USD 119 (suburban): math 27% / reading 41% proficiency, ranked #196 of 620 in IL (top 32%) — families likely to look elsewhere, expect single-tenant / working-renter base with shorter leases.
- Zoned schools: East Dubuque Elem School (math 22% / reading 32%, grade F, #749 of 2,056 statewide, top 40%, 348 students, 0% FRL); East Dubuque Jr High (math 37% / reading 62%, grade C, #51 of 665 statewide, top 9%, 89 students, 0% FRL); East Dubuque High School (math 24% / reading 34%, grade F, #187 of 693 statewide, top 30%, 200 students, 0% FRL) — zoned schools average 0% FRL vs 25% district-wide (25 pts lower); this property's tenant base skews higher-income than the district average.
- Watch-outs: built in 1957 — expect roof / HVAC / electrical / plumbing capex.
- Market conditions: 28 active listings in the ZIP; 1 comparable units currently listed for rent nearby; 58 units permitted in Jo Daviess County in 2024 (0 in 5+ unit buildings).
- Jo Daviess County population projected at -25% by 2050 — secular population decline; favor cash flow + early exit over multi-decade hold.
- 6 sale attempts since 6y ago with the ask held roughly flat each time — persistent listings suggest the price (not the market) is what's stuck; bring a comps-based counter.
- At projected returns (-3.0% appreciation + 3.0% rent growth), your $38k cash investment doubles in ~10 years — after that, you're playing with house money.
Questions for listing agent
- It's been on market 34 days. Have you received any prior offers? Is the seller open to a 3% concession, seller financing, or rate buy-down credit?
- Built in 1957 — when were the roof, HVAC, electrical panel, plumbing, and water heater last replaced?
- Is there a deadline driving the sale (1031 exchange, divorce, estate, relocation)? That informs how much negotiation room exists.
- Schools are D-rated, which usually means shorter tenancies and higher turnover. Who's the typical renter profile here, and what's been the actual vacancy rate?
- What's the average days-on-market for RENTAL listings here right now (not sales)? A rising rental-DOM trend means longer vacancies and softer asking-rent achievability than the comps imply.
- What's the recent tenant-quality profile in this submarket — average credit score on applications, eviction rate, late-payment / NSF rate, and stable-employment percentage? A property-management company in the area should have these aggregated.
- How much new for-sale + rental construction is in the pipeline within 1–3 miles? Heavy new supply typically softens prices + rents 12–24 months out; constrained supply supports both.
CashFlowRE · CFR-ZN36PK9HCYA0K4
· Data 1 day ago
cashflowre.app · 2026-05-29