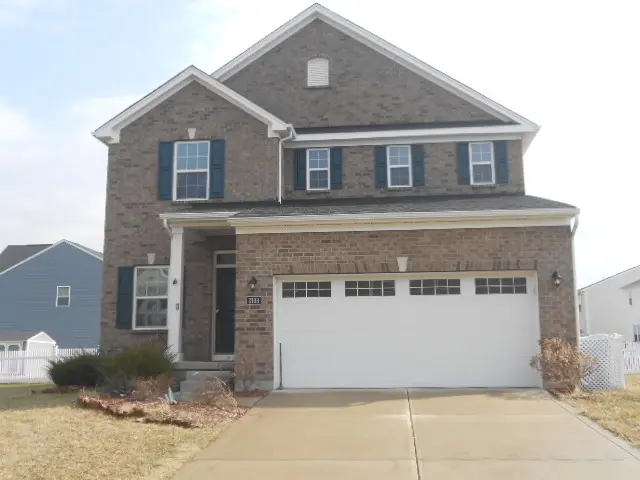
3198 White Ash Dr
Huber Heights, OH 45371
$279,900D
3 bd · 3.5 ba ·
3,313 sqft ·
Built 2020
· SingleFamily
· Active
· 56 DOM
Cashflow @ list (25.0% down · 7.5%)
Estimated rent
$2,285/mo
Mortgage (P&I)
−$1,468
Tax + insurance
−$698
HOA
−$0
Vac / Maint / Mgmt
−$480
Net cashflow
$-361/mo
Annual
$-4,329/yr
Cap rate
4.75%
Cash-on-cash
-5.52%
DSCR
0.75
1% rule
0.82%
Cash to close
$78,372
Investor read
- This is a 3-bed/3.5-bath single-family listed at $280k.
- At list price, monthly cash flow is $-361 ($-4k/yr) — negative.
- To cash-flow at today's rent, offer at most $216k (22.8% below list).
- To meet the 1% rule (rent ≥ 1% of price), the offer needs to be $228k (18.4% below list).
- It's been on market 56 days — a 3% lower offer ($272k) is reasonable based on typical stale-listing flexibility.
- Recommended offer: $216k (22.8% below list) — sets the bar for cash-flow.
- Local home prices are declining (-3.0%/yr); year-one equity from $2k of loan paydown is wiped out by about $8k of value loss. Plan a longer hold.
- Location reads 71/100 on livability (#436 in OH) — a middle-class / working-renter tenant base. Strengths: cost of living A+, housing A+, crime B; Watch: amenities F, commute F, health & safety F.
- Bethel Local (rural): math 63% / reading 69% proficiency, ranked #174 of 656 in OH (top 26%) — acceptable for families but not a draw, mixed tenant base, ~2y average lease; only 12% free/reduced lunch — higher-income household profile.
- Zoned schools: Bethel Elementary School (math 72% / reading 71%, grade A-, #364 of 1,584 statewide, top 23%, 930 students, 24% FRL); Bethel Middle School (math 59% / reading 64%, grade B+, #248 of 654 statewide, top 38%, 483 students, 0% FRL); Bethel High School (math 47% / reading 82%, grade B-, #164 of 781 statewide, top 24%, 455 students, 43% FRL).
- Market conditions: 258 active listings in the ZIP; 1 comparable units currently listed for rent nearby; solid renter incomes; 326 units permitted in Miami County in 2024 (0 in 5+ unit buildings).
- 5 sale attempts since 4y ago; this cycle's ask has dropped $20k (7%) from the opening price — seller is motivated, your offer sets the floor, not the list.
- Cap rate 4.7% vs local median 3.5% in Huber Heights — top-decile yield for the area; either an underpriced asset or a hidden risk that comps aren't pricing in. Stress-test before assuming the spread holds.
Questions for listing agent
- What do current leases actually rent for vs. the listed asking? Can we see a recent rent roll and the last 12 months of T-12 income?
- It's been on market 56 days. Have you received any prior offers? Is the seller open to a 23% concession, seller financing, or rate buy-down credit?
- Is there a deadline driving the sale (1031 exchange, divorce, estate, relocation)? That informs how much negotiation room exists.
- Schools are B-rated — typically a magnet for longer-tenancy family renters. What's the average tenant stay here, and is there a school-zone premium baked into asking?
- The area grade is low — what's the realistic commute time and amenity access for the typical tenant pool here? Any planned neighborhood developments (good or bad) we should know about?
- What's the average days-on-market for RENTAL listings here right now (not sales)? A rising rental-DOM trend means longer vacancies and softer asking-rent achievability than the comps imply.
- What's the recent tenant-quality profile in this submarket — average credit score on applications, eviction rate, late-payment / NSF rate, and stable-employment percentage? A property-management company in the area should have these aggregated.
- How much new for-sale + rental construction is in the pipeline within 1–3 miles? Heavy new supply typically softens prices + rents 12–24 months out; constrained supply supports both.
CashFlowRE · CFR-ZP4GPV4387DD07
· Data 9 h ago
cashflowre.app · 2026-05-29