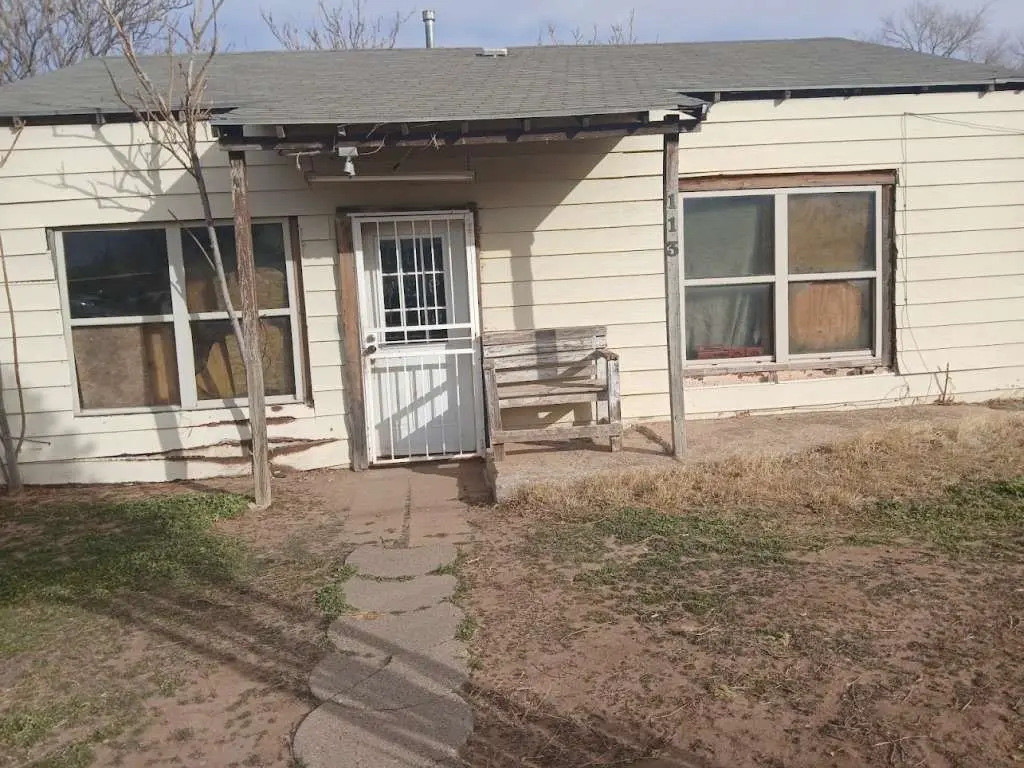
113 Maple St
Levelland, TX 79336
$47,999B-
2 bd · 1.0 ba ·
862 sqft ·
Built 1952
· SingleFamily
· Active
· 307 DOM
Cashflow @ list (25.0% down · 7.5%)
Estimated rent
$922/mo
Mortgage (P&I)
−$252
Tax + insurance
−$96
HOA
−$0
Vac / Maint / Mgmt
−$194
Net cashflow
$381/mo
Annual
$4,570/yr
Cap rate
15.81%
Cash-on-cash
34.00%
DSCR
2.51
1% rule
1.92%
Cash to close
$13,440
Investor read
- This is a 2-bed/1.0-bath single-family listed at $48k.
- At list price, monthly cash flow is $381 ($5k/yr) — positive.
- The deal already cash-flows at list — no discount required.
- Meets the 1% rule at list price ($922 rent vs $48k).
- It's been on market 307 days — a 12% lower offer ($42k) is reasonable based on typical stale-listing flexibility.
- Recommended offer: $42k (12.0% below list) — sets the bar for market timing.
- Local home prices are declining (-3.0%/yr); year-one equity from $332 of loan paydown is wiped out by about $1k of value loss. Plan a longer hold.
- Location reads 72/100 on livability (#274 in TX) — a middle-class / working-renter tenant base. Strengths: cost of living A+, housing A+, health & safety A+; Watch: commute F, employment F.
- Levelland ISD (town): math 33% / reading 32% proficiency, ranked #566 of 826 in TX (top 68%) — families likely to look elsewhere, expect single-tenant / working-renter base with shorter leases; 64% free/reduced lunch — lower-income household profile, screen leases tightly.
- Zoned schools: Levelland Middle (math 32% / reading 31%, grade F, #997 of 1,662 statewide, top 61%, 622 students, 79% FRL); Levelland H S (math 67% / reading 55%, grade C+, #258 of 1,632 statewide, top 16%, 745 students, 67% FRL).
- Zoned-school proficiency averages 46% at this address vs 32% district-wide (+14 pts) — the actual schools serving this property are materially stronger than the Levelland ISD average implies; a family-tenant draw the district grade alone would hide.
- Watch-outs: built in 1952 — expect roof / HVAC / electrical / plumbing capex.
- Market conditions: 120 active listings in the ZIP; 7 comparable units currently listed for rent nearby; rentals at typical pace (median 15d on market — plan ~3-4 weeks tenant-placement turnaround); 7 units permitted in Hockley County in 2024 (0 in 5+ unit buildings).
- Hockley County population projected at +21% by 2050 — long-run rental-demand tailwind backs the buy-and-hold thesis.
- At projected returns (-3.0% appreciation + 3.0% rent growth), your $13k cash investment doubles in ~4 years — after that, you're playing with house money.
Questions for listing agent
- It's been on market 307 days. Have you received any prior offers? Is the seller open to a 12% concession, seller financing, or rate buy-down credit?
- Built in 1952 — when were the roof, HVAC, electrical panel, plumbing, and water heater last replaced?
- Why hasn't it sold? Are there any deal-killer items the seller is aware of (foundation, flood, title, zoning, code violations)?
- Is there a deadline driving the sale (1031 exchange, divorce, estate, relocation)? That informs how much negotiation room exists.
- Schools are F-rated, which usually means shorter tenancies and higher turnover. Who's the typical renter profile here, and what's been the actual vacancy rate?
- What's the average days-on-market for RENTAL listings here right now (not sales)? A rising rental-DOM trend means longer vacancies and softer asking-rent achievability than the comps imply.
- What's the recent tenant-quality profile in this submarket — average credit score on applications, eviction rate, late-payment / NSF rate, and stable-employment percentage? A property-management company in the area should have these aggregated.
- How much new for-sale + rental construction is in the pipeline within 1–3 miles? Heavy new supply typically softens prices + rents 12–24 months out; constrained supply supports both.
CashFlowRE · CFR-ZRG9F1CR4Z49NW
· Data 6 h ago
cashflowre.app · 2026-05-29