1101 Cromwell Hills Dr #1101
Middletown, CT 06416
$182,000D
2 bd · 1.5 ba ·
1,057 sqft ·
Built 1973
· Condo
· Under Contract
· 4 DOM
Cashflow @ list (25.0% down · 7.5%)
Estimated rent
$2,078/mo
Mortgage (P&I)
−$954
Tax + insurance
−$303
HOA
−$484
Vac / Maint / Mgmt
−$436
Net cashflow
$-100/mo
Annual
$-1,199/yr
Cap rate
5.63%
Cash-on-cash
-2.35%
DSCR
0.90
1% rule
1.14%
Cash to close
$50,960
Investor read
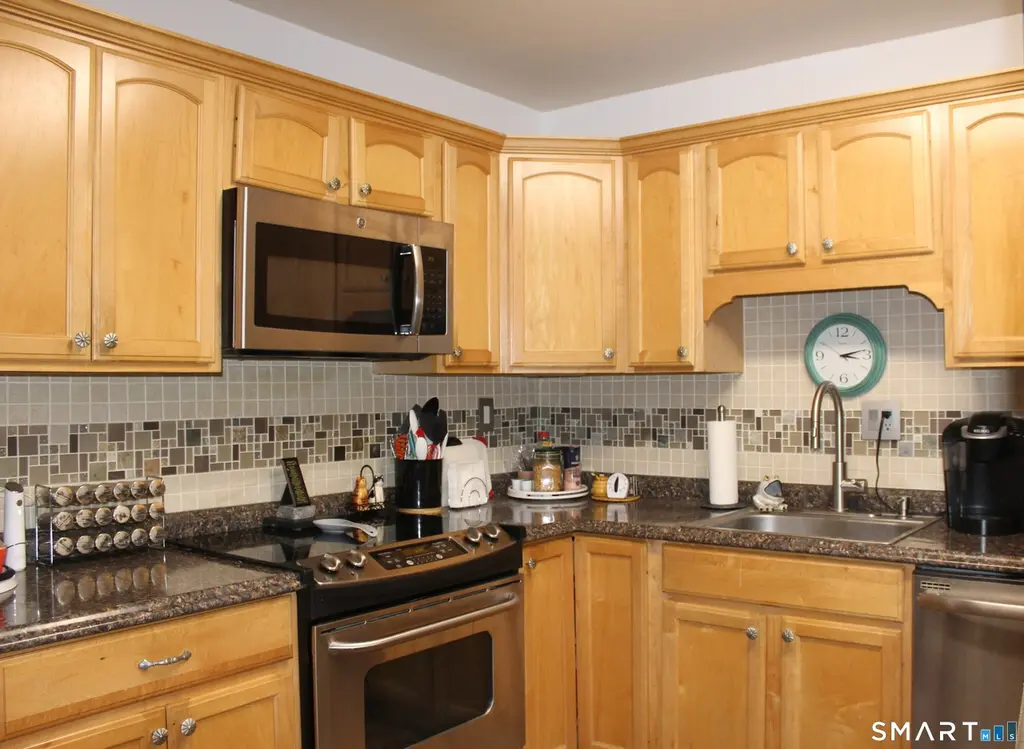
- This is a 2-bed/1.5-bath condo listed at $182k.
- At list price, monthly cash flow is $-100 ($-1k/yr) — negative.
- To cash-flow at today's rent, offer at most $168k (7.9% below list).
- Meets the 1% rule at list price ($2k rent vs $182k).
- Only 4 days on market — expect competitive offers; lowballing is unlikely to land.
- Recommended offer: $168k (7.9% below list) — sets the bar for cash-flow.
- Local home prices are declining (-3.0%/yr); year-one equity from $1k of loan paydown is wiped out by about $5k of value loss. Plan a longer hold.
- Location reads 81/100 on livability (#17 in CT, #1,390 nationally) — a professional / high-income tenant draw. Strengths: crime A+, amenities A+, health & safety A+; Watch: commute F.
- Cromwell School District (suburban): math 51% / reading 58% proficiency, ranked #63 of 153 in CT (top 41%) — acceptable for families but not a draw, mixed tenant base, ~2y average lease; only 14% free/reduced lunch — higher-income household profile.
- Zoned schools: Cromwell High School (math 52% / reading 67%, grade C+, #45 of 194 statewide, top 25%, 536 students, 25% FRL).
- Watch-outs: HOA is 23% of rent.
- Market conditions: 58 active listings in the ZIP; 35 comparable units currently listed for rent nearby; rentals at typical pace (median 17d on market — plan ~3-4 weeks tenant-placement turnaround); high-income renter base; 278 units permitted in Lower Connecticut River Valley Planning Region in 2024 (89 in 5+ unit buildings).
- 7 sale attempts since 18y ago with the ask held roughly flat each time — persistent listings suggest the price (not the market) is what's stuck; bring a comps-based counter.
- Climate carrying-cost: major wind risk, 27% chance of damaging wind over 30y; extreme-heat days projected 7→16/yr by 2055 (HVAC capex compounding) — expect insurance premiums to compound above CPI over the hold.
- Cap rate 5.6% vs local median 3.6% in Middletown — top-decile yield for the area; either an underpriced asset or a hidden risk that comps aren't pricing in. Stress-test before assuming the spread holds.
Questions for listing agent
- What do current leases actually rent for vs. the listed asking? Can we see a recent rent roll and the last 12 months of T-12 income?
- Built in 1973 — when were the roof, HVAC, electrical panel, plumbing, and water heater last replaced?
- What does the HOA fee cover, when was the last increase, and are there any pending special assessments or reserve-fund shortfalls?
- Any open or pending special assessments — roof, HVAC, plumbing, elevator, façade? What's the per-unit balance and payoff schedule, and is the seller paying it off at close or rolling it to the buyer?
- Is there a deadline driving the sale (1031 exchange, divorce, estate, relocation)? That informs how much negotiation room exists.
- The area grade is low — what's the realistic commute time and amenity access for the typical tenant pool here? Any planned neighborhood developments (good or bad) we should know about?
- What's the average days-on-market for RENTAL listings here right now (not sales)? A rising rental-DOM trend means longer vacancies and softer asking-rent achievability than the comps imply.
- What's the recent tenant-quality profile in this submarket — average credit score on applications, eviction rate, late-payment / NSF rate, and stable-employment percentage? A property-management company in the area should have these aggregated.
CashFlowRE · CFR-ZV5FTP2RVPBQZN
· Data 3 weeks ago
cashflowre.app · 2026-05-29