185 Berry River Rd
Rochester, NH 03825
$389,900D+
3 bd · 1.0 ba ·
1,748 sqft ·
Built 2005
· SingleFamily
· Pending
· 21 DOM
Cashflow @ list (25.0% down · 7.5%)
Estimated rent
$2,625/mo
Mortgage (P&I)
−$2,045
Tax + insurance
−$600
HOA
−$42
Vac / Maint / Mgmt
−$551
Net cashflow
$-613/mo
Annual
$-7,353/yr
Cap rate
4.41%
Cash-on-cash
-6.74%
DSCR
0.70
1% rule
0.67%
Cash to close
$109,172
Investor read
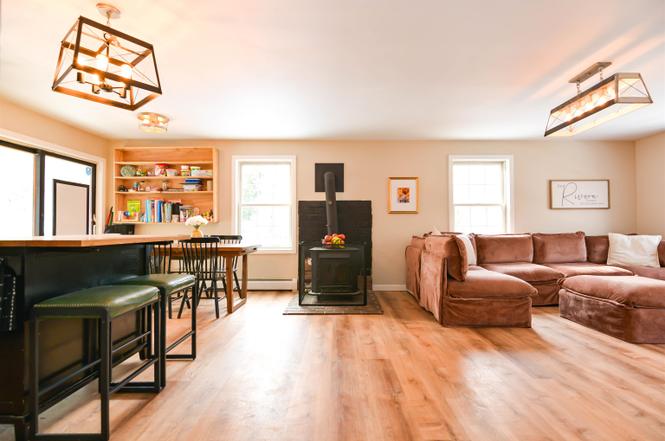
- This is a 3-bed/1.0-bath single-family listed at $390k.
- At list price, monthly cash flow is $-613 ($-7k/yr) — negative.
- To cash-flow at today's rent, offer at most $282k (27.8% below list).
- To meet the 1% rule (rent ≥ 1% of price), the offer needs to be $263k (32.7% below list).
- It's been on market 21 days — a 2% lower offer ($384k) is reasonable based on typical stale-listing flexibility.
- Recommended offer: $263k (32.7% below list) — sets the bar for 1% rule.
- In year one you build about $42k of equity ($3k loan paydown + $39k appreciation (10.0% local appreciation)).
- Location reads 84/100 on livability (#8 in NH, #698 nationally) — a professional / high-income tenant draw. Strengths: crime A+, commute A+, cost of living A+; Watch: amenities C-.
- Barrington School District (rural): math 45% / reading 47% proficiency, ranked #44 of 98 in NH (top 45%) — families likely to look elsewhere, expect single-tenant / working-renter base with shorter leases; only 14% free/reduced lunch — higher-income household profile.
- Zoned schools: Barrington Elementary School (math 42% / reading 42%, grade F, #141 of 263 statewide, top 58%, 424 students, 9% FRL); Barrington Middle School (math 47% / reading 49%, grade C-, #29 of 96 statewide, top 29%, 382 students, 11% FRL) — zoned schools at 10% FRL track the district average.
- Market conditions: 77 active listings in the ZIP; 951 units permitted in Strafford County in 2024 (551 in 5+ unit buildings).
- Strafford County population projected at +7% by 2050 — modest demand growth; plan on rents tracking national, not racing it.
- 5 sale attempts since 5y ago; this cycle's ask has dropped $30k (7%) from the opening price — seller is motivated, your offer sets the floor, not the list.
- Current owner paid $295k; 32% above their basis — modest negotiation headroom, anchor on the comps not their cost.
- By year 2, paydown + projected appreciation supports a ~$67k cash-out refi (75% LTV) — recoverable capital for the next deal without selling this one.
- Cap rate 4.4% vs local median 3.3% in Rochester — top-decile yield for the area; either an underpriced asset or a hidden risk that comps aren't pricing in. Stress-test before assuming the spread holds.
Questions for listing agent
- What do current leases actually rent for vs. the listed asking? Can we see a recent rent roll and the last 12 months of T-12 income?
- What does the HOA fee cover, when was the last increase, and are there any pending special assessments or reserve-fund shortfalls?
- Is there a deadline driving the sale (1031 exchange, divorce, estate, relocation)? That informs how much negotiation room exists.
- The area grade is low — what's the realistic commute time and amenity access for the typical tenant pool here? Any planned neighborhood developments (good or bad) we should know about?
- What's the average days-on-market for RENTAL listings here right now (not sales)? A rising rental-DOM trend means longer vacancies and softer asking-rent achievability than the comps imply.
- What's the recent tenant-quality profile in this submarket — average credit score on applications, eviction rate, late-payment / NSF rate, and stable-employment percentage? A property-management company in the area should have these aggregated.
- How much new for-sale + rental construction is in the pipeline within 1–3 miles? Heavy new supply typically softens prices + rents 12–24 months out; constrained supply supports both.
CashFlowRE · CFR-ZV856PDJZNN31A
· Data 3 weeks ago
cashflowre.app · 2026-05-29