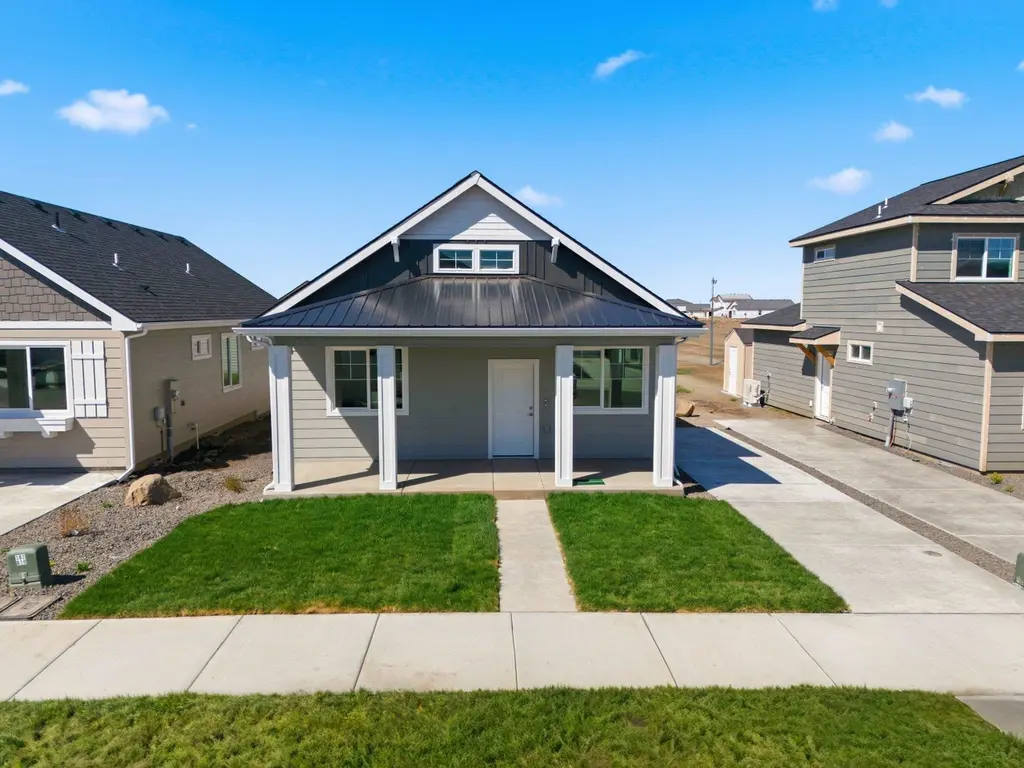
60 S Treeline St
Airway Heights, WA 99001
$325,000D
3 bd · 2.0 ba ·
1,242 sqft ·
Built 2025
· SingleFamily
· Active
· 53 DOM
Cashflow @ list (25.0% down · 7.5%)
Estimated rent
$1,738/mo
Mortgage (P&I)
−$1,704
Tax + insurance
−$199
HOA
−$70
Vac / Maint / Mgmt
−$365
Net cashflow
$-600/mo
Annual
$-7,202/yr
Cap rate
4.08%
Cash-on-cash
-7.91%
DSCR
0.65
1% rule
0.53%
Cash to close
$91,000
Investor read
- This is a 3-bed/2.0-bath single-family listed at $325k.
- At list price, monthly cash flow is $-600 ($-7k/yr) — negative.
- To cash-flow at today's rent, offer at most $219k (32.6% below list).
- To meet the 1% rule (rent ≥ 1% of price), the offer needs to be $174k (46.5% below list).
- It's been on market 53 days — a 3% lower offer ($315k) is reasonable based on typical stale-listing flexibility.
- Recommended offer: $174k (46.5% below list) — sets the bar for 1% rule.
- In year one you build about $4k of equity ($2k loan paydown + $2k appreciation (0.7% local appreciation)).
- Location reads 73/100 on livability (#204 in WA) — a middle-class / working-renter tenant base. Strengths: commute A+, housing A+, health & safety A+; Watch: crime F, amenities D-.
- Cheney School District (town): math 47% / reading 56% proficiency, ranked #140 of 291 in WA (top 48%) — acceptable for families but not a draw, mixed tenant base, ~2y average lease.
- Zoned schools: Sunset Elementary (588 students, 74% FRL); Westwood Middle School (585 students, 61% FRL); Cheney High School (1,476 students, 50% FRL) — zoned schools average 62% FRL vs 40% district-wide (22 pts higher); higher-poverty schools than district average — tighter screening recommended.
- Market conditions: 59 active listings in the ZIP; 10 comparable units currently listed for rent nearby; rentals at typical pace (median 16d on market — plan ~3-4 weeks tenant-placement turnaround); 3,608 units permitted in Spokane County in 2024 (1,792 in 5+ unit buildings).
- Spokane County population projected at +13% by 2050 — modest demand growth; plan on rents tracking national, not racing it.
- By year 7, paydown + projected appreciation supports a ~$32k cash-out refi (75% LTV) — recoverable capital for the next deal without selling this one.
- Cap rate 4.1% vs local median 3.1% in Airway Heights — top-decile yield for the area; either an underpriced asset or a hidden risk that comps aren't pricing in. Stress-test before assuming the spread holds.
- This rent runs 33% of the median local income ($63k/yr) — at the standard rent-burdened threshold; future hikes will face affordability resistance.
Questions for listing agent
- What do current leases actually rent for vs. the listed asking? Can we see a recent rent roll and the last 12 months of T-12 income?
- It's been on market 53 days. Have you received any prior offers? Is the seller open to a 47% concession, seller financing, or rate buy-down credit?
- What does the HOA fee cover, when was the last increase, and are there any pending special assessments or reserve-fund shortfalls?
- Is there a deadline driving the sale (1031 exchange, divorce, estate, relocation)? That informs how much negotiation room exists.
- Schools are F-rated, which usually means shorter tenancies and higher turnover. Who's the typical renter profile here, and what's been the actual vacancy rate?
- Crime grade is F in this area — have there been break-ins, vandalism, or insurance claims at this property in the last 3 years? What carrier currently insures it and at what premium?
- The area grade is low — what's the realistic commute time and amenity access for the typical tenant pool here? Any planned neighborhood developments (good or bad) we should know about?
- What's the average days-on-market for RENTAL listings here right now (not sales)? A rising rental-DOM trend means longer vacancies and softer asking-rent achievability than the comps imply.
CashFlowRE · CFR-ZWN1TS5H6TZ13D
· Data 7 h ago
cashflowre.app · 2026-05-29