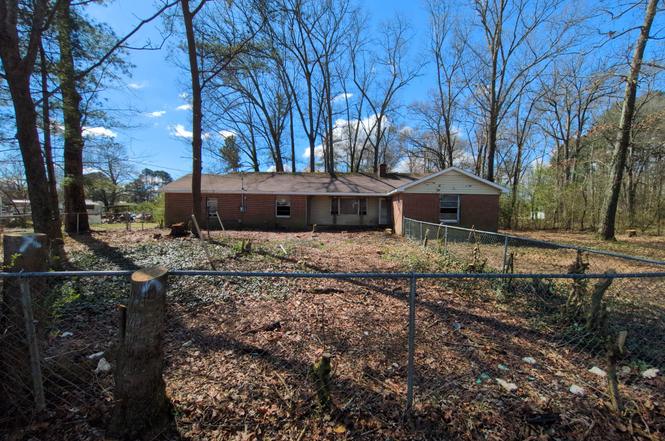
71 Oakwood Ln
Lynchburg, Moore County, TN 37388
$150,000C+
4 bd · 2.0 ba ·
2,231 sqft ·
Built 1960
· SingleFamily
· Active
· 105 DOM
Cashflow @ list (25.0% down · 7.5%)
Estimated rent
$1,775/mo
Mortgage (P&I)
−$787
Tax + insurance
−$152
HOA
−$0
Vac / Maint / Mgmt
−$373
Net cashflow
$464/mo
Annual
$5,564/yr
Cap rate
10.00%
Cash-on-cash
13.25%
DSCR
1.59
1% rule
1.18%
Cash to close
$42,000
Investor read
- This is a 4-bed/2.0-bath single-family listed at $150k.
- At list price, monthly cash flow is $464 ($6k/yr) — positive.
- The deal already cash-flows at list — no discount required.
- Meets the 1% rule at list price ($2k rent vs $150k).
- It's been on market 105 days — a 9% lower offer ($136k) is reasonable based on typical stale-listing flexibility.
- Recommended offer: $136k (9.0% below list) — sets the bar for market timing.
- Local home prices are declining (-3.0%/yr); year-one equity from $1k of loan paydown is wiped out by about $4k of value loss. Plan a longer hold.
- Location reads: area grade C — affects rentability + tenant quality, not the cash-flow math above.
- Franklin County (town): math 18% / reading 22% proficiency, ranked #111 of 139 in TN (top 80%) — low school quality limits family demand, transient renter base, plan for 1-2y turnover.
- Zoned schools: North Lake Elementary (math 42% / reading 32%, grade F, #272 of 952 statewide, top 31%, 225 students, 0% FRL); Franklin Co High School (math 5% / reading 22%, grade F, #255 of 332 statewide, top 77%, 1,180 students, 0% FRL) — zoned schools average 0% FRL vs 48% district-wide (48 pts lower); this property's tenant base skews higher-income than the district average.
- Market conditions: 326 active listings in the ZIP; 422 units permitted in Franklin County in 2024 (5 in 5+ unit buildings).
- Franklin County population projected at +6% by 2050 — modest demand growth; plan on rents tracking national, not racing it.
- Current owner paid $92k; list at $150k implies a 63% gain — meaningful room to come down on a strong offer.
- At projected returns (-3.0% appreciation + 3.0% rent growth), your $42k cash investment doubles in ~9 years — after that, you're playing with house money.
- Cap rate 10.0% vs local median 1.7% in Lynchburg, Moore County — top-decile yield for the area; either an underpriced asset or a hidden risk that comps aren't pricing in. Stress-test before assuming the spread holds.
- This rent runs 36% of the median local income ($60k/yr) — at the standard rent-burdened threshold; future hikes will face affordability resistance.
Questions for listing agent
- It's been on market 105 days. Have you received any prior offers? Is the seller open to a 9% concession, seller financing, or rate buy-down credit?
- Built in 1960 — when were the roof, HVAC, electrical panel, plumbing, and water heater last replaced?
- Why hasn't it sold? Are there any deal-killer items the seller is aware of (foundation, flood, title, zoning, code violations)?
- Is there a deadline driving the sale (1031 exchange, divorce, estate, relocation)? That informs how much negotiation room exists.
- What's the average days-on-market for RENTAL listings here right now (not sales)? A rising rental-DOM trend means longer vacancies and softer asking-rent achievability than the comps imply.
- What's the recent tenant-quality profile in this submarket — average credit score on applications, eviction rate, late-payment / NSF rate, and stable-employment percentage? A property-management company in the area should have these aggregated.
- How much new for-sale + rental construction is in the pipeline within 1–3 miles? Heavy new supply typically softens prices + rents 12–24 months out; constrained supply supports both.
CashFlowRE · CFR-018G8B9MG72PDA
· Data 1 day ago
cashflowre.app · 2026-05-29