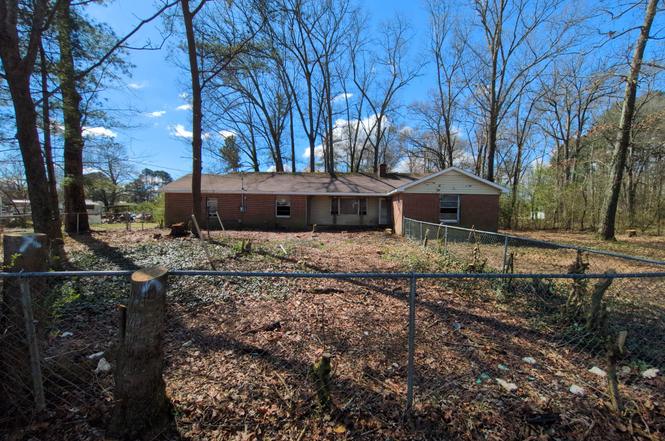
71 Oakwood Ln · Lynchburg, Moore County, TN
Flood risk 1/10 · Minimal
- FEMA flood zone
- X (unshaded)
- Chance of flooding over 30 yrs
- 0.0%
- Est. flood insurance / yr
- $507 – $1,088
Fire risk 4/10 · Minor
- Est. fire insurance / yr
- $949 – $1,763
Heat risk 4/10 · Minor
- Hot days now (above 103°F)
- 7 days/yr
- Hot days in 30 yrs
- 20 days/yr
Wind risk 4/10 · Minor
- Chance of severe wind over 30 yrs
- 11.0%
Air-quality risk 2/10 · Minimal
- Unhealthy air days now
- 1 days/yr
- Unhealthy air days in 30 yrs
- 1 days/yr
Risk factors via First Street. Map © Google.
Why this score? — see what drove the C+ grade
The composite is a weighted blend of 9 inputs, each scored 0–100. Each bar is that input's sub-score; the figure is the points it added to the 100-point composite (weight × sub-score).
- Cash flow +27.9/30.0
- DSCR +9.9/10.0
- ARV discount +7.5/15.0
- 1% rule +6.8/10.0
- Rent growth +2.5/5.0
- Livability +2.5/5.0
- Condition / age +2.5/5.0
- Schools +1.7/10.0
- Appreciation +0.0/10.0
$150,000
🖨 Deal sheet 📄 Offer letter ✓ Due diligence
Listing remarks
* * home sale contingency fell through * * 4-bedroom, 2-bath brick home on a 1.54 acre wooded lot offering approximately 2,231 square feet. Built in 1960, the property presents a clear opportunity for investors or contractors looking for a full renovation project. The level, wooded lot provides space and privacy that is increasingly difficult to find. Recent cleanup has removed debris and cleared trees around the home, opening up the property and making it easier to evaluate. Cash or renovation financing likely required. Property is being sold as-is and the seller will make no repairs. Utilities may not be active. Enter at your own risk; some parts of the floor may not be safe to walk on
Key facts
- Wooded lot
- Space and privacy
- 1.54 acre lot
Tags
Property features AI
Finance
- Financial info: Annual property tax listed (amount provided in original data)
Exterior
- Parking: No covered or designated parking spaces listed
- Utilities: Private water; Septic tank sewer; Water available
- Home design: Single-family residence; One story
- Construction: Brick construction; Brick/mortar foundation; Approximate year built
- Exterior features: Lot approximately 1.54 acres
Interior
- Kitchen: No appliances listed
- Bedrooms: 4 bedrooms (all on main level)
- Flooring: Wood
- Bathrooms: 2 full bathrooms
- Heating & cooling: Central heating; Central air conditioning
- Interior features: Wood flooring; Crawl space basement
- Laundry & utility: No laundry appliances listed
Neighborhood map
What this means for you Summary
Snapshot
- This is a 4-bed/2.0-bath single-family listed at $150k.
Deal economics
- At list price, monthly cash flow is $464 ($6k/yr) — positive.
- The deal already cash-flows at list — no discount required.
- Meets the 1% rule at list price ($2k rent vs $150k).
- Recommended offer: $136k (9.0% below list) — sets the bar for market timing.
- Cap rate 10.0% vs local median 1.7% in Lynchburg, Moore County — top-decile yield for the area; either an underpriced asset or a hidden risk that comps aren't pricing in. Stress-test before assuming the spread holds.
Location & tenants
- Location reads: area grade C — affects rentability + tenant quality, not the cash-flow math above.
- Franklin County (town): math 18% / reading 22% proficiency, ranked #111 of 139 in TN (top 80%) — low school quality limits family demand, transient renter base, plan for 1-2y turnover.
- Zoned schools: North Lake Elementary (math 42% / reading 32%, grade F, #272 of 952 statewide, top 31%, 225 students, 0% FRL); Franklin Co High School (math 5% / reading 22%, grade F, #255 of 332 statewide, top 77%, 1,180 students, 0% FRL) — zoned schools average 0% FRL vs 48% district-wide (48 pts lower); this property's tenant base skews higher-income than the district average.
- Market conditions: 326 active listings in the ZIP; 422 units permitted in Franklin County in 2024 (5 in 5+ unit buildings).
- This rent runs 36% of the median local income ($60k/yr) — at the standard rent-burdened threshold; future hikes will face affordability resistance.
Forward outlook
- Local home prices are declining (-3.0%/yr); year-one equity from $1k of loan paydown is wiped out by about $4k of value loss. Plan a longer hold.
- Franklin County population projected at +6% by 2050 — modest demand growth; plan on rents tracking national, not racing it.
- At projected returns (-3.0% appreciation + 3.0% rent growth), your $42k cash investment doubles in ~9 years — after that, you're playing with house money.
Negotiation context
- It's been on market 105 days — a 9% lower offer ($136k) is reasonable based on typical stale-listing flexibility.
- Current owner paid $92k; list at $150k implies a 63% gain — meaningful room to come down on a strong offer.
Questions for the listing agent
- It's been on market 105 days. Have you received any prior offers? Is the seller open to a 9% concession, seller financing, or rate buy-down credit?
- Built in 1960 — when were the roof, HVAC, electrical panel, plumbing, and water heater last replaced?
- Why hasn't it sold? Are there any deal-killer items the seller is aware of (foundation, flood, title, zoning, code violations)?
- Is there a deadline driving the sale (1031 exchange, divorce, estate, relocation)? That informs how much negotiation room exists.
- What's the average days-on-market for RENTAL listings here right now (not sales)? A rising rental-DOM trend means longer vacancies and softer asking-rent achievability than the comps imply.
- What's the recent tenant-quality profile in this submarket — average credit score on applications, eviction rate, late-payment / NSF rate, and stable-employment percentage? A property-management company in the area should have these aggregated.
- How much new for-sale + rental construction is in the pipeline within 1–3 miles? Heavy new supply typically softens prices + rents 12–24 months out; constrained supply supports both.
Investment metrics
- 1% rule
- 1.18% ✓
- Cap rate
- 10.00%
- Cash-on-cash
- 13.25%
- DSCR
- 1.59
- GRM
- 7.0
CMA / ARV
No comps found within radius.
Projected returns pro-forma
-3.0% appreciation · 3.0% rent growth · sell at horizon
- IRR
- 3.2%
- Equity multiple
- 1.12×
- Total profit
- $5,194
- Equity at exit
- $22,365
- IRR
- 12.7%
- Equity multiple
- 2.01×
- Total profit
- $42,416
- Equity at exit
- $12,969
Cash invested: $42,000 (down + closing). Projections, not guarantees.
Landlord ↔ Tenant lean methodology
- Overall (STATE)
- 87 Strongly Landlord-Friendly
- State Tennessee
- 87 Strongly Landlord-Friendly · R+13
- County
- — inherits STATE
- City
- — inherits STATE
ZIP-level market 37388
- Home prices YoY
- -19.9%
- Active inventory
- 326
- Price-to-rent
- 7.0×
Monthly cashflow live
- Estimated rent
- $1,775 medium interval (Pro) →
- Mortgage (P&I)
- −$787
- Tax from tax record
- −$90 /mo · $1,076/yr
- Insurance
- −$62
- HOA
- −$0
- Vacancy / Maint / Mgmt
- −$373
- Net cashflow
- $464
Break-even live
UW: 25.0% down · 7.5% · 30yr · 1.5% tax · 5.0% vac · 8.0% maint · 8.0% mgmt
Financing live
Cash to close
- Down payment
- $37,500
- Closing costs
- $4,500
- Reserves months
- —
- Total cash needed
- —
Loan-product check · same deal, 3 products live
Conventional
25% down · 7.5% · 30yr
- Down + closing
- —
- Monthly P&I
- —
- Monthly cashflow
- —
- DSCR
- —
- Eligible?
- —
Personal DTI + credit; lowest rate.
DSCR
20% down · 8.5% · 30yr
- Down + closing
- —
- Monthly P&I
- —
- Monthly cashflow
- —
- DSCR
- —
- Eligible?
- —
No personal income docs; deal must DSCR.
Hard money
10% down · 12.0% · 12mo
- Down + closing
- —
- Monthly P&I
- —
- Monthly cashflow
- —
- DSCR
- —
- Eligible?
- —
Short-term bridge; refi at stabilization.
Listing history 22 events
-
2026-06-19days on market $150,000 Active 105 DOM
-
2026-06-18days on market $150,000 Active 104 DOM
-
2026-06-17days on market $150,000 Active 103 DOM
-
2026-06-16days on market $150,000 Active 102 DOM
-
2026-06-15days on market $150,000 Active 101 DOM
-
2026-06-14days on market $150,000 Active 99 DOM
-
2026-06-13days on market $150,000 Active 98 DOM
-
2026-06-10days on market $150,000 Active 96 DOM
-
2026-06-09days on market $150,000 Active 95 DOM
-
2026-06-09price $150,000 Active 94 DOM
-
2026-06-08days on market $165,000 Active 94 DOM
-
2026-06-07days on market $165,000 Active 93 DOM
-
2026-06-05days on market $165,000 Active 90 DOM
-
2026-06-03days on market $165,000 Active 89 DOM
-
2026-06-03status $165,000 Active 88 DOM
-
2026-06-02days on market $165,000 Active Under Contract 88 DOM
-
2026-06-01days on market $165,000 Active Under Contract 87 DOM
-
2026-05-31days on market $165,000 Active Under Contract 86 DOM
-
2026-05-30days on market $165,000 Active Under Contract 85 DOM
-
2026-04-04historical Active Under Contract
-
2026-03-07$165,000 Active
-
2005-08-02soldstatus $92,000
ⓘ Source: listings_history table (triggers on properties + properties_extension) + one-shot
backfill from property_details.listing_events for pre-trigger history.
Tax reassessment forecast TN · Resets to sale price
- Current annual tax
- $1,076 · $90/mo
- Projected year-2 tax
- $1,076 · $90/mo
- Expected delta
- $0/yr ($0/mo · 0.0%)
ⓘ Screening estimate from a state-policy table — verify with the county assessor before closing.
Climate risk First Street
- Flood 1/10 Low FEMA zone X (unshaded) · 0% chance over 30 yrs
- Wildfire 4/10 Moderate
- Heat 4/10 Moderate 7 d/yr ≥103°F today · 20 d/yr by 30 yrs out
- Wind 4/10 Moderate 11% chance of damaging wind over 30 yrs
- Air quality 2/10 Low 1 unhealthy d/yr today · 1 by 30 yrs out
Nearby sold comps map
Loading sold comps map…
Walkable amenities ~0.75 mi
Loading nearby amenities…
Taxation est. · year 1
- Rental income
- $21,304
- − Mortgage interest
- −$8,402
- − Property taxes
- −$1,076
- − Insurance
- −$750
- − Repairs & maintenance
- −$1,704
- − Management
- −$1,704
- − Depreciation
- −$4,364
- Taxable income
- $3,303
- Est. tax owed @ 24.0%
- −$793
- After-tax cash flow
- $4,772/yr
For passive investors: Depreciation is non-cash, so a rental often shows a tax loss while cash-flowing — sheltering income. Rental losses are passive: they offset passive income freely, and up to $25,000/yr can offset ordinary (W-2) income if you actively participate and your MAGI is under $100k (phasing out to $0 by $150k); unused losses carry forward. On sale, claimed depreciation is recaptured at up to 25%, and gains may owe capital-gains tax (a 1031 exchange can defer both). Figures are a year-1 estimate at your 24.0% rate — not tax advice; consult a CPA.
Schools (NCES district)
- District
- Franklin County
- NCES district ID
- 4701290
- Math proficiency
- 18% ▼ -9.00%
- Reading proficiency
- 22% ▼ -8.00%
- Median HH income
- $43,108
- Composite
- 17.24/100
- National rank
- #9094
- State rank
- #111 of 139 in TN
Livability — Lynchburg, Moore County
No livability data for this city. (Only ~50 U.S. cities are tracked.)
Census & demographics
- County
- Coffee County · 57,744 people
- City population
- 3,089
- Metro
- Tullahoma-Manchester, TN
- Population (ZIP)
- 27,939
- Household income
- $59,537
- Rent vs Own
- Severe rent burden
- 693.0
Population outlook (Franklin County) Hauer SSP2
- Today (2025)
- 42,858 people
- By 2030
- 43,540 · +1.6%
- By 2040
- 44,623 · +4.1%
- By 2050
- 45,523 · +6.2%
- By 2075
- 48,954 · +14.2%
- By 2100
- 50,170 · +17.1%
Race, ethnicity, and origin ACS 2023
- Neighborhood character
- Predominantly White (86%)
- Race & ethnicity
- White 86% Two or more races 6% Hispanic / Latino 5% Black 5%
- Hispanic origin (detail)
- Mexican 2%
- Common ancestry
- Slovak 3% Italian 3% Serbian 2%
- Foreign-born
- 2% · Canada, China
- Languages at home
- 96% English-only · Spanish 3%
Political lean MEDSL · Franklin
- 2024 margin
- Solid R (+53.2) · D 23.0% · R 76.1%
- 2008→2024 swing
- -30.6pp toward R · 2008: -22.5pp · 2024: -53.2pp
- All cycles
- 2024: R+53.2 2020: R+47.7 2016: R+43.7 2012: R+28.9 2008: R+22.5
Not yet ingested
- Civics
- —
Market trends
- HPI YoY
- ▼ -78.82%
- Current HPI
- 317.7062
- Rent YoY
- —
- Metro
- Tullahoma-Manchester, TN
- State GDP YoY
- ▲ 2.78%
- F500 in state
- 22
Industry mix (Fortune 500 HQ in TN)
| Industry | F500 HQs | Revenue |
|---|---|---|
| Healthcare | 3 | $91B |
|
||
| Retail | 3 | $72B |
|
||
| Transportation / Logistics | 1 | $88B |
|
||
| Paper / Packaging | 1 | $19B |
|
||
| Insurance | 1 | $13B |
|
||
| Energy | 1 | $12B |
|
||
Price history
+79.3% since first listed3 events — show timeline
- 2026-04-04 Contingent — REALTRACS as Distributed by MLS Grid
- 2026-03-07 Listed $165,000 REALTRACS as Distributed by MLS Grid
- 2005-08-02 Sold (Public Records) $92,000 Public Records
Property tax history
+4.0%/yrLatest (2025): $1,076 · +0.0% YoY. Source: county tax records.
Cash-flow waterfall
monthlySold comps — $/sqft
last 12 mo · ≤1 miLoading sold comps…