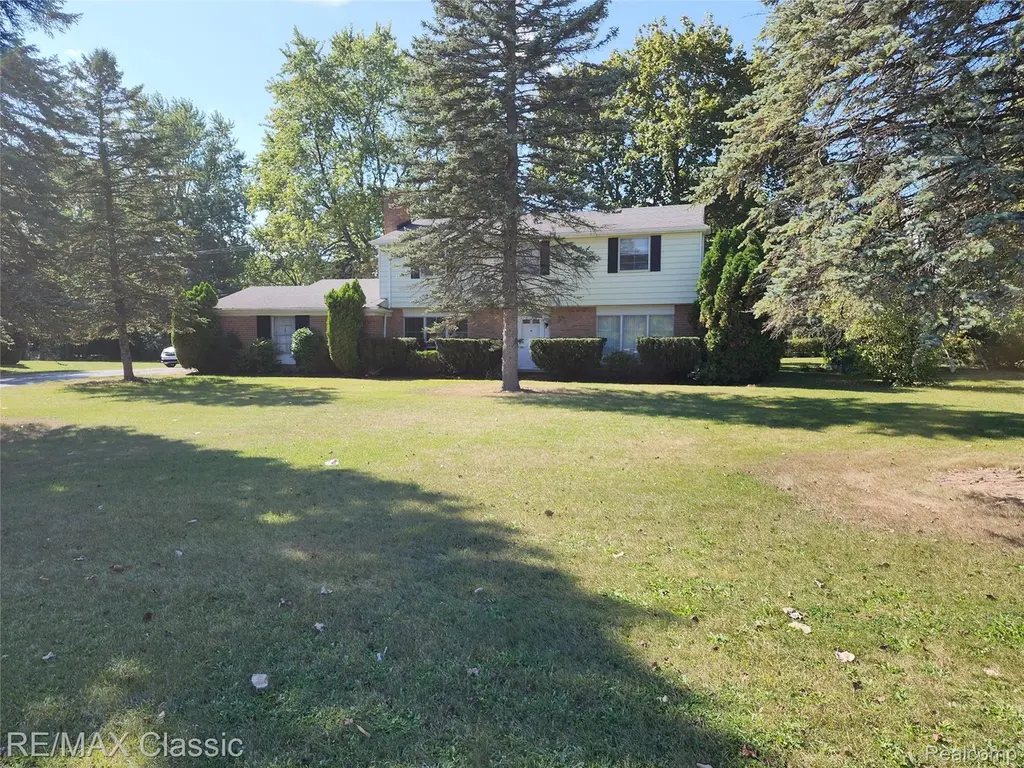
6965 N Adams Rd
Troy, MI 48304
$345,000C+
4 bd · 2.5 ba ·
2,155 sqft ·
Built 1961
· SingleFamily
· Active
· 20 DOM
Cashflow @ list (25.0% down · 7.5%)
Estimated rent
$3,587/mo
Mortgage (P&I)
−$1,809
Tax + insurance
−$395
HOA
−$6
Vac / Maint / Mgmt
−$753
Net cashflow
$623/mo
Annual
$7,480/yr
Cap rate
8.46%
Cash-on-cash
7.74%
DSCR
1.34
1% rule
1.04%
Cash to close
$96,600
Investor read
- This is a 4-bed/2.5-bath single-family listed at $345k.
- At list price, monthly cash flow is $623 ($7k/yr) — positive.
- The deal already cash-flows at list — no discount required.
- Meets the 1% rule at list price ($4k rent vs $345k).
- It's been on market 20 days — a 2% lower offer ($340k) is reasonable based on typical stale-listing flexibility.
- Recommended offer: $340k (1.5% below list) — sets the bar for market timing.
- Local home prices are declining (-3.0%/yr); year-one equity from $2k of loan paydown is wiped out by about $10k of value loss. Plan a longer hold.
- Location reads 78/100 on livability (#113 in MI, #2,684 nationally) — a middle-class / working-renter tenant base. Strengths: employment A+, housing A+, crime A; Watch: health & safety D+, amenities F, commute F.
- Avondale School District (suburban): math 34% / reading 48% proficiency, ranked #162 of 540 in MI (top 30%) — families likely to look elsewhere, expect single-tenant / working-renter base with shorter leases.
- Zoned schools: R Grant Graham Elem School (math 22% / reading 27%, grade F, #980 of 1,397 statewide, top 74%, 376 students, 61% FRL); Avondale Middle School (math 30% / reading 43%, grade F, #264 of 493 statewide, top 54%, 630 students, 58% FRL); Avondale High School (math 37% / reading 67%, grade D+, #128 of 713 statewide, top 19%, 1,004 students, 48% FRL) — zoned schools average 56% FRL vs 28% district-wide (28 pts higher); higher-poverty schools than district average — tighter screening recommended.
- Market conditions: 132 active listings in the ZIP; 6 comparable units currently listed for rent nearby; rentals leasing fast (median 1d on market — plan ~1-2 weeks tenant-placement turnaround); high-income renter base; 2,614 units permitted in Oakland County in 2024 (721 in 5+ unit buildings).
- Oakland County population projected at +10% by 2050 — modest demand growth; plan on rents tracking national, not racing it.
- 4 sale attempts with the ask held roughly flat each time — persistent listings suggest the price (not the market) is what's stuck; bring a comps-based counter.
- Cap rate 8.5% vs local median 3.6% in Troy — top-decile yield for the area; either an underpriced asset or a hidden risk that comps aren't pricing in. Stress-test before assuming the spread holds.
- This rent runs 30% of the median local income ($143k/yr) — at the standard rent-burdened threshold; future hikes will face affordability resistance.
Questions for listing agent
- Built in 1961 — when were the roof, HVAC, electrical panel, plumbing, and water heater last replaced?
- What does the HOA fee cover, when was the last increase, and are there any pending special assessments or reserve-fund shortfalls?
- Is there a deadline driving the sale (1031 exchange, divorce, estate, relocation)? That informs how much negotiation room exists.
- Schools are A-rated — typically a magnet for longer-tenancy family renters. What's the average tenant stay here, and is there a school-zone premium baked into asking?
- What's the average days-on-market for RENTAL listings here right now (not sales)? A rising rental-DOM trend means longer vacancies and softer asking-rent achievability than the comps imply.
- What's the recent tenant-quality profile in this submarket — average credit score on applications, eviction rate, late-payment / NSF rate, and stable-employment percentage? A property-management company in the area should have these aggregated.
- How much new for-sale + rental construction is in the pipeline within 1–3 miles? Heavy new supply typically softens prices + rents 12–24 months out; constrained supply supports both.
CashFlowRE · CFR-02PXE0A8QXYAY7
· Data 1 day ago
cashflowre.app · 2026-05-29