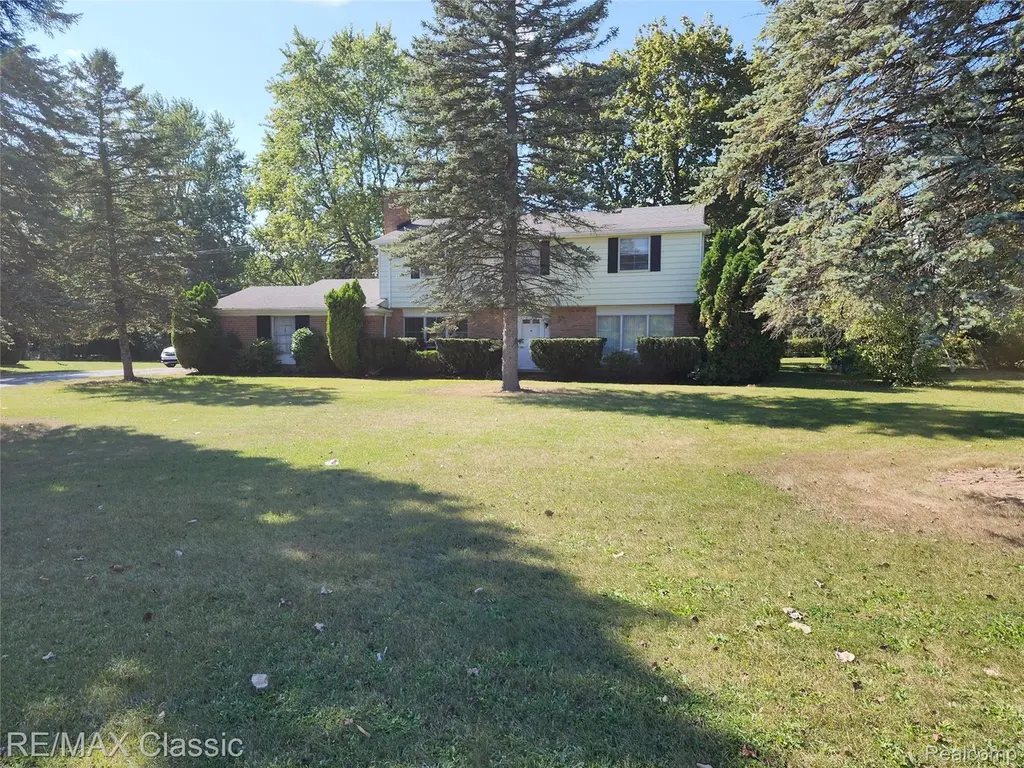
6965 N Adams Rd · Troy, MI
Flood risk 1/10 · Minimal
- FEMA flood zone
- X (unshaded)
- Chance of flooding over 30 yrs
- 0.0%
- Est. flood insurance / yr
- $473 – $860
Fire risk 1/10 · Minimal
- Est. fire insurance / yr
- $784 – $1,456
Heat risk 2/10 · Minimal
- Hot days now (above 98°F)
- 7 days/yr
- Hot days in 30 yrs
- 15 days/yr
Wind risk 2/10 · Minimal
- Chance of severe wind over 30 yrs
- —
Air-quality risk 3/10 · Minor
- Unhealthy air days now
- 2 days/yr
- Unhealthy air days in 30 yrs
- 5 days/yr
Risk factors via First Street. Map © Google.
Why this score? — see what drove the C+ grade
The composite is a weighted blend of 9 inputs, each scored 0–100. Each bar is that input's sub-score; the figure is the points it added to the 100-point composite (weight × sub-score).
- Cash flow +23.2/30.0
- ARV discount +14.5/15.0
- DSCR +7.4/10.0
- 1% rule +5.4/10.0
- Livability +3.9/5.0
- Schools +3.7/10.0
- Rent growth +2.5/5.0
- Condition / age +2.5/5.0
- Appreciation +0.0/10.0
$345,000
🖨 Deal sheet (PDF) 📄 Offer letter ✓ Due diligence
Listing remarks
Welcome to this delightful Colonial home, offering 2,155 square feet of comfortable living space with 4 spacious bedrooms and 2.5 bathrooms. Situated in the highly desirable Chapel Hill Estates, this property rests on a beautiful, tree-lined lot that provides both charm and privacy. Inside, the home boasts an owner’s suite with a full private bathroom, along with three additional generously sized bedrooms. The spacious eat-in kitchen is ideal for everyday meals and gatherings, while the formal living room and family room provide ample space for entertaining. The family room also includes a versatile area that can easily accommodate a second dining table or be tailored to your lifestyl
Key facts
- Accessible location
- Eat in kitchen
- Family room
Tags
Property features AI
Finance
- Other: Lot about 0.52 acre (approx. 150 x 150)
- HOA & community: Homeowners association with $75 annual fee (about $6.25/month)
Exterior
- Parking: Attached 2-car garage with direct access, garage door opener; garage faces side
- Utilities: Water: Other; Sewer: Septic tank
- Home design: Single-family residence; Two-story home; Ground-level entry; Brick and vinyl siding exterior; Faces unspecified direction
- Construction: Asphalt roof; Slab foundation
- Exterior features: Patio; Paved road access
Interior
- Bathrooms: Two full bathrooms; One half bathroom
- Heating & cooling: Forced air heating (natural gas); No central air conditioning
- Interior features: Living room fireplace; Gas water heater; Total of 8 rooms
Neighborhood map
What this means for you Summary
Snapshot
- This is a 4-bed/2.5-bath single-family listed at $345k.
Deal economics
- At list price, monthly cash flow is $623 ($7k/yr) — positive.
- The deal already cash-flows at list — no discount required.
- Meets the 1% rule at list price ($4k rent vs $345k).
- Recommended offer: $340k (1.5% below list) — sets the bar for market timing.
- Cap rate 8.5% vs local median 3.6% in Troy — top-decile yield for the area; either an underpriced asset or a hidden risk that comps aren't pricing in. Stress-test before assuming the spread holds.
Location & tenants
- Location reads 78/100 on livability (#113 in MI, #2,684 nationally) — a middle-class / working-renter tenant base. Strengths: employment A+, housing A+, crime A; Watch: health & safety D+, amenities F, commute F.
- Avondale School District (suburban): math 34% / reading 48% proficiency, ranked #162 of 540 in MI (top 30%) — families likely to look elsewhere, expect single-tenant / working-renter base with shorter leases.
- Zoned schools: R Grant Graham Elem School (math 22% / reading 27%, grade F, #980 of 1,397 statewide, top 74%, 376 students, 61% FRL); Avondale Middle School (math 30% / reading 43%, grade F, #264 of 493 statewide, top 54%, 630 students, 58% FRL); Avondale High School (math 37% / reading 67%, grade D+, #128 of 713 statewide, top 19%, 1,004 students, 48% FRL) — zoned schools average 56% FRL vs 28% district-wide (28 pts higher); higher-poverty schools than district average — tighter screening recommended.
- Market conditions: 132 active listings in the ZIP; 6 comparable units currently listed for rent nearby; rentals leasing fast (median 0d on market — plan ~1-2 weeks tenant-placement turnaround); high-income renter base; 2,614 units permitted in Oakland County in 2024 (721 in 5+ unit buildings).
- This rent runs 30% of the median local income ($143k/yr) — at the standard rent-burdened threshold; future hikes will face affordability resistance.
Forward outlook
- Local home prices are declining (-3.0%/yr); year-one equity from $2k of loan paydown is wiped out by about $10k of value loss. Plan a longer hold.
- Oakland County population projected at +10% by 2050 — modest demand growth; plan on rents tracking national, not racing it.
Negotiation context
- It's been on market 20 days — a 2% lower offer ($340k) is reasonable based on typical stale-listing flexibility.
- 4 sale attempts with the ask held roughly flat each time — persistent listings suggest the price (not the market) is what's stuck; bring a comps-based counter.
Questions for the listing agent
- Built in 1961 — when were the roof, HVAC, electrical panel, plumbing, and water heater last replaced?
- What does the HOA fee cover, when was the last increase, and are there any pending special assessments or reserve-fund shortfalls?
- Is there a deadline driving the sale (1031 exchange, divorce, estate, relocation)? That informs how much negotiation room exists.
- Schools are A-rated — typically a magnet for longer-tenancy family renters. What's the average tenant stay here, and is there a school-zone premium baked into asking?
- What's the average days-on-market for RENTAL listings here right now (not sales)? A rising rental-DOM trend means longer vacancies and softer asking-rent achievability than the comps imply.
- What's the recent tenant-quality profile in this submarket — average credit score on applications, eviction rate, late-payment / NSF rate, and stable-employment percentage? A property-management company in the area should have these aggregated.
- How much new for-sale + rental construction is in the pipeline within 1–3 miles? Heavy new supply typically softens prices + rents 12–24 months out; constrained supply supports both.
Investment metrics
- 1% rule
- 1.04% ✓
- Cap rate
- 8.46%
- Cash-on-cash
- 7.74%
- DSCR
- 1.34
- GRM
- 8.0
CMA / ARV
- ARV (median comp)
- $408,640
- List price
- $345,000
- Delta
- -14.35%
- Verdict
- UNDERPRICED
- Comps
- 20 within 1.0 mi
Show comp detail 12 sales within ~0.75 mi
| Address | Dist | Beds/Ba | Sqft | Sold | Price | $/sf | Match |
|---|---|---|---|---|---|---|---|
| 942 Linden Way | 0.19mi | 3/2.5 (-1) | 2,146 (-0%) | 2mo | $429,000 | $200 | 84 |
| 820 Linden Way | 0.28mi | 4/2.5 | 2,399 (+11%) | 10mo | $459,900 | $192 | 60 |
| 2800 Tewksbury Dr | 0.52mi | 3/2.5 (-1) | 2,350 (+9%) | 1mo | $605,000 | $257 | 55 |
| 1186 Peveril Rd | 0.59mi | 3/3.0 (-1) | 2,311 (+7%) | 0mo | $539,000 | $233 | 53 |
| 1420 Ashover Dr | 0.35mi | 4/2.5 | 2,469 (+15%) | 8mo | $477,000 | $193 | 52 |
| 1358 Winchcombe Dr | 0.16mi | 3/1.5 (-1) | 2,424 (+12%) | 12mo | $365,000 | $151 | 52 |
| 1659 Ledbury Dr | 0.24mi | 3/2.0 (-1) | 2,460 (+14%) | 7mo | $360,000 | $146 | 52 |
| 3397 EASTWOOD Dr | 0.72mi | 3/2.5 (-1) | 2,016 (-6%) | 0mo | $519,900 | $258 | 50 |
| 2546 Limerick Ln | 0.61mi | 4/3.0 | 2,296 (+6%) | 11mo | $605,000 | $264 | 50 |
| 724 Nichols Rd | 0.43mi | 3/1.0 (-1) | 2,280 (+6%) | 12mo | $270,000 | $118 | 49 |
| 1141 Winchcombe Dr | 0.66mi | 3/2.0 (-1) | 2,367 (+10%) | 2mo | $425,000 | $180 | 44 |
| 3257 Saint Clair Dr | 0.68mi | 4/3.0 | 2,452 (+14%) | 10mo | $370,000 | $151 | 35 |
Match score weights: distance 35% · size 25% · config 20% · recency 20%. Top-matched comps best support the ARV.
Projected returns pro-forma
-3.0% appreciation · 3.0% rent growth · sell at horizon
- IRR
- -4.5%
- Equity multiple
- 0.83×
- Total profit
- $-16,255
- Equity at exit
- $51,441
- IRR
- 5.2%
- Equity multiple
- 1.38×
- Total profit
- $36,755
- Equity at exit
- $29,829
Cash invested: $96,600 (down + closing). Projections, not guarantees.
Landlord ↔ Tenant lean methodology
- Overall (STATE)
- 62 Landlord-Friendly
- State Michigan
- 62 Landlord-Friendly · EVEN
- County
- — inherits STATE
- City
- — inherits STATE
ZIP-level market 48304
- Active inventory
- 132
- Price-to-rent
- 8.0×
Monthly cashflow live
- Estimated rent
- $3,587 high interval (Pro) →
- Mortgage (P&I)
- −$1,809
- Tax from tax record
- −$252 /mo · $3,021/yr
- Insurance
- −$144
- HOA
- −$6
- Vacancy / Maint / Mgmt
- −$753
- Net cashflow
- $623
Break-even live
Sensitivity live
| Price | -10% $819 | -5% $721 | +0% $623 | +5% $526 | +10% $428 |
|---|---|---|---|---|---|
| Rent | -10% $340 | -5% $482 | +0% $623 | +5% $765 | +10% $907 |
| Rate | -1.0pp $797 | -0.5pp $711 | base $623 | +0.5pp $534 | +1.0pp $443 |
UW: 25.0% down · 7.5% · 30yr · 1.5% tax · 5.0% vac · 8.0% maint · 8.0% mgmt
Financing live
Cash to close
- Down payment
- $86,250
- Closing costs
- $10,350
- Reserves months
- —
- Total cash needed
- —
Loan-product check · same deal, 3 products live
Conventional
25% down · 7.5% · 30yr
- Down + closing
- —
- Monthly P&I
- —
- Monthly cashflow
- —
- DSCR
- —
- Eligible?
- —
Personal DTI + credit; lowest rate.
DSCR
20% down · 8.5% · 30yr
- Down + closing
- —
- Monthly P&I
- —
- Monthly cashflow
- —
- DSCR
- —
- Eligible?
- —
No personal income docs; deal must DSCR.
Hard money
10% down · 12.0% · 12mo
- Down + closing
- —
- Monthly P&I
- —
- Monthly cashflow
- —
- DSCR
- —
- Eligible?
- —
Short-term bridge; refi at stabilization.
Rent comps 6 comps
| Address | Beds | Baths | Sqft | Rent | $/sqft | DOM | Units | Dist |
|---|---|---|---|---|---|---|---|---|
| 3200 South Blvd Bloomfield Hills, MI | 2.0–3.0 | 2.0 | 1782 | $4,250 | $2.38 | 0d | 1 | 0.77mi |
| 915 Huntclub Blvd Auburn Hills, MI | 4.0 | 2.5 | 2403 | $3,200 | $1.33 | 17d | 1 | 0.98mi |
| 124 Optimist Unit 1201 Rochester Hills, MI | 3.0 | 2.5 | 2504 | $3,535 | $1.41 | 0d | 1 | 1.17mi |
| 124 Optimist Auburn Hills, MI | 3.0 | 2.0–2.5 | 2123 | $3,042 | $1.43 | 0d | 5 | 1.17mi |
| 201 N Squirrel Rd Auburn Hills, MI | 2.0–3.0 | 2.5–3.0 | 1475 | $2,320 | $1.57 | 0d | 15 | 1.40mi |
| 676 Sheffield Rd Auburn Hills, MI | 3.0 | 1.5 | 1421 | $2,495 | $1.76 | 0d | 1 | 1.50mi |
HOA detail
- Monthly dues
- $6 · $72/yr
Listing history 17 events
-
2026-06-21days on market $345,000 Active 20 DOM
-
2026-06-18days on market $345,000 Active 17 DOM
-
2026-06-17days on market $345,000 Active 16 DOM
-
2026-06-16days on market $345,000 Active 15 DOM
-
2026-06-15days on market $345,000 Active 14 DOM
-
2026-06-13days on market $345,000 Active 12 DOM
-
2026-06-13days on market $345,000 Active 11 DOM
-
2026-06-09days on market $345,000 Active 8 DOM
-
2026-06-08days on market $345,000 Active 7 DOM
-
2026-06-07days on market $345,000 Active 6 DOM
-
2026-06-04days on market $345,000 Active 3 DOM
-
2026-06-03days on market $345,000 Active 2 DOM
-
2026-06-02pricedays on market $345,000 Active 1 DOM
-
2026-06-01days on market $350,000 Active 241 DOM
-
2026-05-31days on market $350,000 Active 240 DOM
-
2025-10-03$350,000 Active 1176-char remark
-
2025-10-03$350,000 Active 1170-char remark
ⓘ Source: listings_history table (triggers on properties + properties_extension) + one-shot
backfill from property_details.listing_events for pre-trigger history.
Tax reassessment forecast MI · Partial reset (capped growth)
- Current annual tax
- $3,021 · $252/mo
- Projected year-2 tax
- $4,167 · $347/mo
- Expected delta
- +$1,146/yr (+$96/mo · 37.9%)
ⓘ Screening estimate from a state-policy table — verify with the county assessor before closing.
Climate risk First Street
- Flood 1/10 Low FEMA zone X (unshaded) · 0% chance over 30 yrs
- Wildfire 1/10 Low
- Heat 2/10 Low 7 d/yr ≥98°F today · 15 d/yr by 30 yrs out
- Wind 2/10 Low
- Air quality 3/10 Moderate 2 unhealthy d/yr today · 5 by 30 yrs out
Nearby sold comps map
Loading sold comps map…
Walkable amenities ~0.75 mi
Loading nearby amenities…
Taxation est. · year 1
- Rental income
- $43,049
- − Mortgage interest
- −$19,325
- − Property taxes
- −$3,021
- − Insurance
- −$1,725
- − Repairs & maintenance
- −$3,444
- − Management
- −$3,444
- − HOA
- −$72
- − Depreciation
- −$10,036
- Taxable income
- $1,982
- Est. tax owed @ 24.0%
- −$476
- After-tax cash flow
- $7,005/yr
For passive investors: Depreciation is non-cash, so a rental often shows a tax loss while cash-flowing — sheltering income. Rental losses are passive: they offset passive income freely, and up to $25,000/yr can offset ordinary (W-2) income if you actively participate and your MAGI is under $100k (phasing out to $0 by $150k); unused losses carry forward. On sale, claimed depreciation is recaptured at up to 25%, and gains may owe capital-gains tax (a 1031 exchange can defer both). Figures are a year-1 estimate at your 24.0% rate — not tax advice; consult a CPA.
Schools (NCES district)
- District
- Avondale School District
- NCES district ID
- 2603690
- Math proficiency
- 34% ▼ -8.00%
- Reading proficiency
- 48% ▼ -4.00%
- Median HH income
- $71,549
- Composite
- 37.33/100
- National rank
- #4442
- State rank
- #162 of 540 in MI
Livability — Troy
- Score
- 78/100
- State rank
- #113
- US rank
- #2684
Category grades
Schools grade is shown separately in the Schools card above.
Census & demographics
- County
- Oakland County · 1,009,092 people
- City population
- 87,898
- Metro
- Detroit-Warren-Dearborn, MI
- Population (ZIP)
- 17,387
- Household income
- $143,204
- Rent vs Own
- Severe rent burden
- 85.0
Population outlook (Oakland County) Hauer SSP2
- Today (2025)
- 1,335,747 people
- By 2030
- 1,375,100 · +2.9%
- By 2040
- 1,435,385 · +7.5%
- By 2050
- 1,469,250 · +10.0%
- By 2075
- 1,531,946 · +14.7%
- By 2100
- 1,450,485 · +8.6%
Race, ethnicity, and origin ACS 2023
- Neighborhood character
- Predominantly White (79%)
- Race & ethnicity
- White 79% Asian 10% Two or more races 4% Black 4% Hispanic / Latino 2%
- Common ancestry
- Romanian 6% Lithuanian 3% Slovak 2%
- Foreign-born
- 17% · China, Canada, South Korea
- Languages at home
- 79% English-only · Other Indo-European 6% Arabic 5% Other Asian/Pacific 3%
Political lean MEDSL · Oakland
- 2024 margin
- D (+10.6) · D 54.4% · R 43.8% · Other 1.9%
- 2008→2024 swing
- -3.9pp toward R · 2008: 14.5pp · 2024: 10.6pp
- All cycles
- 2024: D+10.6 2020: D+14.1 2016: D+8.1 2012: D+8.1 2008: D+14.5
Not yet ingested
- Civics
- —
Market trends
- HPI YoY
- ▼ -195.96%
- Current HPI
- 160.6477
- Rent YoY
- —
- Metro
- Detroit-Warren-Dearborn, MI
- State GDP YoY
- ▲ 1.37%
- F500 in state
- 28
Industry mix (Fortune 500 HQ in MI)
| Industry | F500 HQs | Revenue |
|---|---|---|
| Automotive Parts | 3 | $48B |
|
||
| Automotive | 2 | $372B |
|
||
| Chemicals | 1 | $45B |
|
||
| Automotive Retail | 1 | $29B |
|
||
| Healthcare / Medical Devices | 1 | $23B |
|
||
| Automotive Technology | 1 | $20B |
|
||
Price history
-1.4% since first listed6 events — show timeline
- 2026-06-01 Listed $345,000 REALCOMP
- 2026-06-01 Listed $345,000 MiRealSource-MiMLS
- 2026-06-01 Listing Removed — MiRealSource-MiMLS
- 2026-06-01 Listing Removed — REALCOMP
- 2025-10-03 Listed $350,000 REALCOMP
- 2025-10-03 Listed $350,000 MiRealSource-MiMLS
Property tax history
+2.1%/yrLatest (2025): $3,021 · +2.7% YoY. Source: county tax records.
Cash-flow waterfall
monthlySold comps — $/sqft
last 12 mo · ≤1 miLoading sold comps…