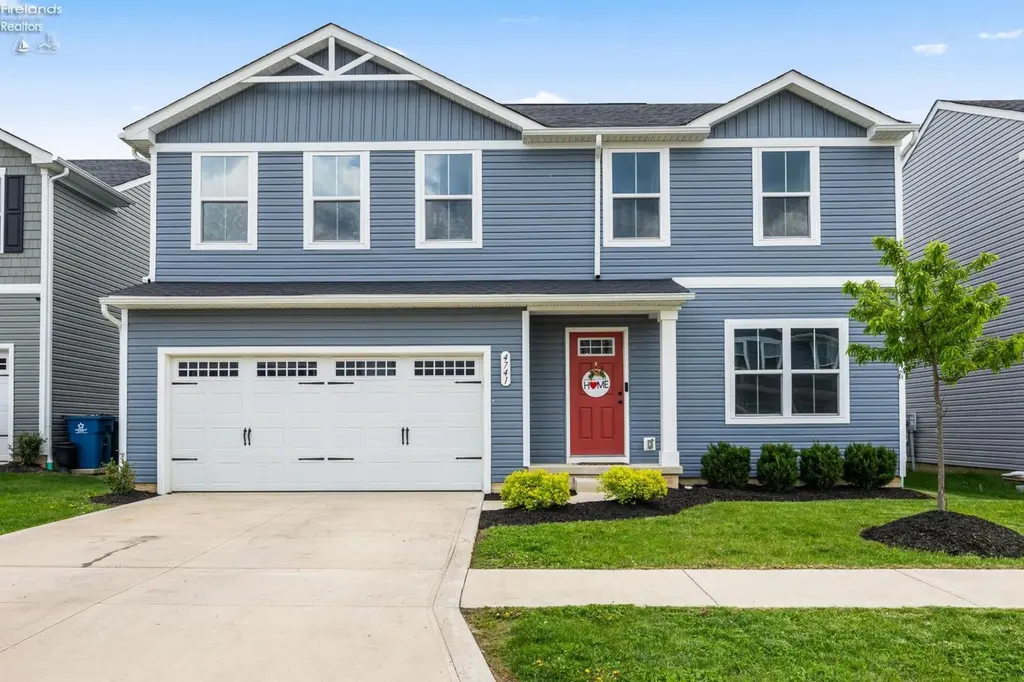
4741 Olivia Way
Lorain, OH 44053
$339,900D
4 bd · 2.5 ba ·
1,980 sqft ·
Built 2022
· SingleFamily
· Pending
· 6 DOM
Cashflow @ list (25.0% down · 7.5%)
Estimated rent
$2,486/mo
Mortgage (P&I)
−$1,782
Tax + insurance
−$228
HOA
−$0
Vac / Maint / Mgmt
−$522
Net cashflow
$-46/mo
Annual
$-555/yr
Cap rate
6.13%
Cash-on-cash
-0.58%
DSCR
0.97
1% rule
0.73%
Cash to close
$95,172
Investor read
- This is a 4-bed/2.5-bath single-family listed at $340k.
- At list price, monthly cash flow is $-46 ($-555/yr) — negative.
- To cash-flow at today's rent, offer at most $332k (2.4% below list).
- To meet the 1% rule (rent ≥ 1% of price), the offer needs to be $249k (26.9% below list).
- Only 6 days on market — expect competitive offers; lowballing is unlikely to land.
- Recommended offer: $249k (26.9% below list) — sets the bar for 1% rule.
- Local home prices are declining (-3.0%/yr); year-one equity from $2k of loan paydown is wiped out by about $10k of value loss. Plan a longer hold.
- Location reads 67/100 on livability (#595 in OH) — a middle-class / working-renter tenant base. Strengths: cost of living A+, housing A+; Watch: amenities D, health & safety D, crime F.
- Amherst Exempted Village (suburban): math 66% / reading 69% proficiency, ranked #160 of 656 in OH (top 24%) — acceptable for families but not a draw, mixed tenant base, ~2y average lease; only 18% free/reduced lunch — higher-income household profile.
- Zoned schools: Powers Elementary School (math 66% / reading 64%, grade B+, #516 of 1,584 statewide, top 33%, 1,123 students, 28% FRL); Amherst Junior High School (math 65% / reading 68%, grade A-, #172 of 654 statewide, top 27%, 867 students, 31% FRL); Marion L Steele High School (math 48% / reading 78%, grade B-, #199 of 781 statewide, top 25%, 1,039 students, 28% FRL).
- Market conditions: 82 active listings in the ZIP; 5 comparable units currently listed for rent nearby; rentals leasing fast (median 13d on market — plan ~1-2 weeks tenant-placement turnaround); 1,098 units permitted in Lorain County in 2024 (20 in 5+ unit buildings).
- 2 sale attempts with the ask held roughly flat each time — persistent listings suggest the price (not the market) is what's stuck; bring a comps-based counter.
- This rent runs 44% of the median local income ($67k/yr) — at the standard rent-burdened threshold; future hikes will face affordability resistance.
Questions for listing agent
- What do current leases actually rent for vs. the listed asking? Can we see a recent rent roll and the last 12 months of T-12 income?
- Is there a deadline driving the sale (1031 exchange, divorce, estate, relocation)? That informs how much negotiation room exists.
- Crime grade is F in this area — have there been break-ins, vandalism, or insurance claims at this property in the last 3 years? What carrier currently insures it and at what premium?
- The area grade is low — what's the realistic commute time and amenity access for the typical tenant pool here? Any planned neighborhood developments (good or bad) we should know about?
- What's the average days-on-market for RENTAL listings here right now (not sales)? A rising rental-DOM trend means longer vacancies and softer asking-rent achievability than the comps imply.
- What's the recent tenant-quality profile in this submarket — average credit score on applications, eviction rate, late-payment / NSF rate, and stable-employment percentage? A property-management company in the area should have these aggregated.
- How much new for-sale + rental construction is in the pipeline within 1–3 miles? Heavy new supply typically softens prices + rents 12–24 months out; constrained supply supports both.
CashFlowRE · CFR-03285ZDQGSRHTS
· Data 2 weeks ago
cashflowre.app · 2026-05-29