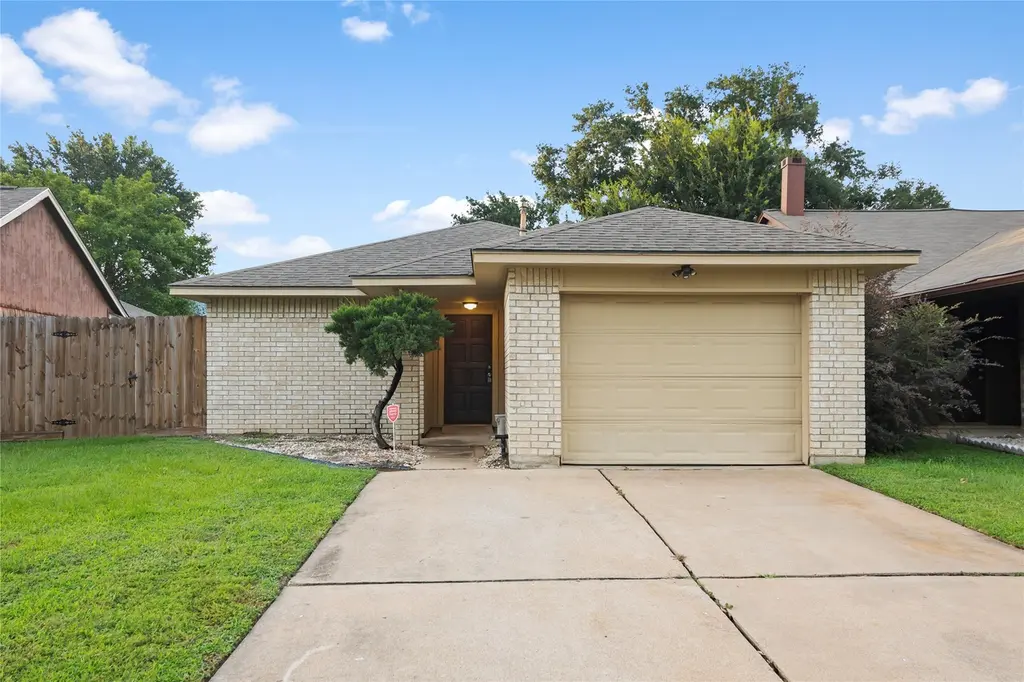
19946 Mountain Dale Dr
Houston, TX 77433
$197,500D
3 bd · 2.0 ba ·
1,289 sqft ·
Built 1983
· SingleFamily
· Pending
· 17 DOM
Cashflow @ list (25.0% down · 7.5%)
Estimated rent
$1,968/mo
Mortgage (P&I)
−$1,036
Tax + insurance
−$520
HOA
−$39
Vac / Maint / Mgmt
−$413
Net cashflow
$-40/mo
Annual
$-479/yr
Cap rate
6.05%
Cash-on-cash
-0.87%
DSCR
0.96
1% rule
1.00%
Cash to close
$55,300
Investor read
- This is a 3-bed/2.0-bath single-family listed at $198k.
- At list price, monthly cash flow is $-40 ($-479/yr) — negative.
- To cash-flow at today's rent, offer at most $190k (3.6% below list).
- To meet the 1% rule (rent ≥ 1% of price), the offer needs to be $197k (0.4% below list).
- It's been on market 17 days — a 2% lower offer ($195k) is reasonable based on typical stale-listing flexibility.
- Recommended offer: $190k (3.6% below list) — sets the bar for cash-flow.
- Local home prices are declining (-3.0%/yr); year-one equity from $1k of loan paydown is wiped out by about $6k of value loss. Plan a longer hold.
- Location reads 74/100 on livability (#184 in TX, #4,771 nationally) — a middle-class / working-renter tenant base. Strengths: amenities A+, cost of living A+, housing A+; Watch: crime F.
- Cypress-Fairbanks ISD (suburban): math 45% / reading 52% proficiency, ranked #161 of 826 in TX (top 20%) — families likely to look elsewhere, expect single-tenant / working-renter base with shorter leases.
- Zoned schools: Hopper Middle (math 24% / reading 34%, grade F, #1,103 of 1,662 statewide, top 67%, 930 students, 80% FRL); Cypress Springs H S (math 35% / reading 60%, grade D, #583 of 1,632 statewide, top 36%, 2,788 students, 68% FRL) — zoned schools average 74% FRL vs 43% district-wide (31 pts higher); higher-poverty schools than district average — tighter screening recommended.
- Watch-outs: property tax is 2.7% of price.
- Market conditions: Rents soft (-1.3%/yr); 2034 active listings in the ZIP; 39 comparable units currently listed for rent nearby; rentals at typical pace (median 22d on market — plan ~3-4 weeks tenant-placement turnaround); high-income renter base; 29,883 units permitted in Harris County in 2024 (8,621 in 5+ unit buildings).
- Harris County population projected at +47% by 2050 — long-run rental-demand tailwind backs the buy-and-hold thesis.
- Current owner paid $37k; list at $198k implies a 434% gain — meaningful room to come down on a strong offer.
- Climate carrying-cost: major flood risk; severe wind risk, 99% chance of damaging wind over 30y; extreme-heat days projected 7→24/yr by 2055 (HVAC capex compounding) — expect insurance premiums to compound above CPI over the hold.
- Cap rate 6.1% vs local median 3.2% in Houston — top-decile yield for the area; either an underpriced asset or a hidden risk that comps aren't pricing in. Stress-test before assuming the spread holds.
- This rent is only 16% of the median local income ($144k/yr) — well below the 30% rent-burden line; pricing power to push rent on renewal without tenant pushback.
Questions for listing agent
- What do current leases actually rent for vs. the listed asking? Can we see a recent rent roll and the last 12 months of T-12 income?
- Property tax is high relative to price — has the assessment been appealed recently, and will the sale trigger a re-assessment?
- What does the HOA fee cover, when was the last increase, and are there any pending special assessments or reserve-fund shortfalls?
- Is there a deadline driving the sale (1031 exchange, divorce, estate, relocation)? That informs how much negotiation room exists.
- Schools are D-rated, which usually means shorter tenancies and higher turnover. Who's the typical renter profile here, and what's been the actual vacancy rate?
- Crime grade is F in this area — have there been break-ins, vandalism, or insurance claims at this property in the last 3 years? What carrier currently insures it and at what premium?
- The area grade is low — what's the realistic commute time and amenity access for the typical tenant pool here? Any planned neighborhood developments (good or bad) we should know about?
- What's the average days-on-market for RENTAL listings here right now (not sales)? A rising rental-DOM trend means longer vacancies and softer asking-rent achievability than the comps imply.
CashFlowRE · CFR-035W2ZCFCB7A4P
· Data 2 days ago
cashflowre.app · 2026-05-29