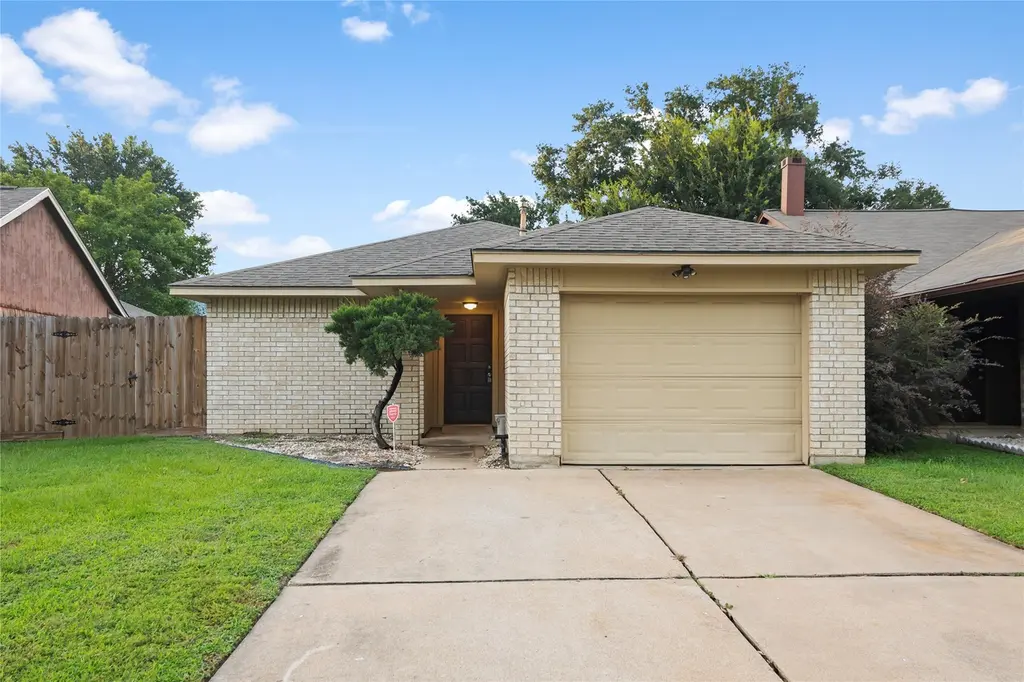
19946 Mountain Dale Dr · Houston, TX
Flood risk 6/10 · Moderate
- FEMA flood zone
- X (unshaded)
- Chance of flooding over 30 yrs
- 0.67%
- Est. flood insurance / yr
- $507 – $1,088
Fire risk 3/10 · Minor
- Est. fire insurance / yr
- $1,222 – $2,270
Heat risk 9/10 · Severe
- Hot days now (above 110°F)
- 7 days/yr
- Hot days in 30 yrs
- 24 days/yr
Wind risk 8/10 · Major
- Chance of severe wind over 30 yrs
- 99.0%
Air-quality risk 2/10 · Minimal
- Unhealthy air days now
- 2 days/yr
- Unhealthy air days in 30 yrs
- 2 days/yr
Risk factors via First Street. Map © Google.
Why this score? — see what drove the D grade
The composite is a weighted blend of 9 inputs, each scored 0–100. Each bar is that input's sub-score; the figure is the points it added to the 100-point composite (weight × sub-score).
- Cash flow +12.2/30.0
- ARV discount +11.5/15.0
- 1% rule +5.0/10.0
- Schools +4.4/10.0
- Livability +3.7/5.0
- DSCR +3.6/10.0
- Condition / age +2.5/5.0
- Rent growth +2.2/5.0
- Appreciation +0.0/10.0
$197,500
🖨 Deal sheet 📄 Offer letter ✓ Due diligence
Listing remarks
Updated one-story home in Lancaster offering peace of mind with major system upgrades already completed. Recent improvements include a new HVAC system (2025), full-home PEX repipe (2025), interior/exterior paint (2023), updated flooring (2023), energy-efficient windows (2022), and a water heater (2021). Just off the entry, the spacious family room features luxury vinyl plank flooring and a cozy wood-burning fireplace, creating the perfect gathering space. The kitchen offers abundant cabinet storage and matching stainless steel appliances and flows seamlessly into the adjoining dining room. The generously sized primary suite includes dual closets and a private ensuite bath with a walk-in sho
Key facts
- Large backyard
- New hvac system
- Full-home pex repipe
Tags
Property features AI
Finance
- HOA & community: Lancaster HOA with an annual fee of $470
Exterior
- Parking: Attached garage (1 car)
- Utilities: Public water; Public sewer
- Home design: Residential property; Built in 1983; Slab foundation; Composition roof
- Construction: Brick construction
- Exterior features: Deck; Patio; Fence (back yard); Private yard; Subdivision setting
Interior
- Kitchen: Dishwasher; Gas oven; Gas range; Microwave
- Bedrooms: Primary bedroom on the first floor (approximately 14 x 13); Second bedroom on the first floor (approximately 12 x 10); Third bedroom on the first floor (approximately 11 x 10)
- Flooring: Carpet; Plank; Vinyl
- Bathrooms: 2 full bathrooms
- Heating & cooling: Central heating (gas); Central electric air conditioning
- Interior features: Wood-burning fireplace; Tub with shower
- Laundry & utility: Has heating and cooling (see Heating & cooling section for details)
Neighborhood map
What this means for you Summary
Snapshot
- This is a 3-bed/2.0-bath single-family listed at $198k.
Deal economics
- At list price, monthly cash flow is $-40 ($-479/yr) — negative.
- To cash-flow at today's rent, offer at most $190k (3.6% below list).
- To meet the 1% rule (rent ≥ 1% of price), the offer needs to be $197k (0.4% below list).
- Recommended offer: $190k (3.6% below list) — sets the bar for cash-flow.
- Cap rate 6.1% vs local median 3.2% in Houston — top-decile yield for the area; either an underpriced asset or a hidden risk that comps aren't pricing in. Stress-test before assuming the spread holds.
Location & tenants
- Location reads 74/100 on livability (#184 in TX, #4,771 nationally) — a middle-class / working-renter tenant base. Strengths: amenities A+, cost of living A+, housing A+; Watch: crime F.
- Cypress-Fairbanks ISD (suburban): math 45% / reading 52% proficiency, ranked #161 of 826 in TX (top 20%) — families likely to look elsewhere, expect single-tenant / working-renter base with shorter leases.
- Zoned schools: Hopper Middle (math 24% / reading 34%, grade F, #1,103 of 1,662 statewide, top 67%, 930 students, 80% FRL); Cypress Springs H S (math 35% / reading 60%, grade D, #583 of 1,632 statewide, top 36%, 2,788 students, 68% FRL) — zoned schools average 74% FRL vs 43% district-wide (31 pts higher); higher-poverty schools than district average — tighter screening recommended.
- Market conditions: Rents soft (-1.3%/yr); 2034 active listings in the ZIP; 39 comparable units currently listed for rent nearby; rentals at typical pace (median 22d on market — plan ~3-4 weeks tenant-placement turnaround); high-income renter base; 29,883 units permitted in Harris County in 2024 (8,621 in 5+ unit buildings).
- This rent is only 16% of the median local income ($144k/yr) — well below the 30% rent-burden line; pricing power to push rent on renewal without tenant pushback.
Forward outlook
- Local home prices are declining (-3.0%/yr); year-one equity from $1k of loan paydown is wiped out by about $6k of value loss. Plan a longer hold.
- Harris County population projected at +47% by 2050 — long-run rental-demand tailwind backs the buy-and-hold thesis.
Negotiation context
- It's been on market 17 days — a 2% lower offer ($195k) is reasonable based on typical stale-listing flexibility.
- Current owner paid $37k; list at $198k implies a 434% gain — meaningful room to come down on a strong offer.
Risks & watch-outs
- Watch-outs: property tax is 2.7% of price.
- Climate carrying-cost: major flood risk; severe wind risk, 99% chance of damaging wind over 30y; extreme-heat days projected 7→24/yr by 2055 (HVAC capex compounding) — expect insurance premiums to compound above CPI over the hold.
Questions for the listing agent
- What do current leases actually rent for vs. the listed asking? Can we see a recent rent roll and the last 12 months of T-12 income?
- Property tax is high relative to price — has the assessment been appealed recently, and will the sale trigger a re-assessment?
- What does the HOA fee cover, when was the last increase, and are there any pending special assessments or reserve-fund shortfalls?
- Is there a deadline driving the sale (1031 exchange, divorce, estate, relocation)? That informs how much negotiation room exists.
- Schools are D-rated, which usually means shorter tenancies and higher turnover. Who's the typical renter profile here, and what's been the actual vacancy rate?
- Crime grade is F in this area — have there been break-ins, vandalism, or insurance claims at this property in the last 3 years? What carrier currently insures it and at what premium?
- The area grade is low — what's the realistic commute time and amenity access for the typical tenant pool here? Any planned neighborhood developments (good or bad) we should know about?
- What's the average days-on-market for RENTAL listings here right now (not sales)? A rising rental-DOM trend means longer vacancies and softer asking-rent achievability than the comps imply.
- What's the recent tenant-quality profile in this submarket — average credit score on applications, eviction rate, late-payment / NSF rate, and stable-employment percentage? A property-management company in the area should have these aggregated.
- How much new for-sale + rental construction is in the pipeline within 1–3 miles? Heavy new supply typically softens prices + rents 12–24 months out; constrained supply supports both.
Investment metrics
- 1% rule
- 1.00% ✗
- Cap rate
- 6.05%
- Cash-on-cash
- -0.87%
- DSCR
- 0.96
- GRM
- 8.4
CMA / ARV
- ARV (on-the-fly)
- $216,552
- Comps found
- 12
Show comp detail 12 sales within ~0.75 mi
| Address | Dist | Beds/Ba | Sqft | Sold | Price | $/sf | Match |
|---|---|---|---|---|---|---|---|
| 19927 Mountain Dale Dr | 0.08mi | 3/2.0 | 1,282 (-0%) | 1mo | $199,000 | $155 | 94 |
| 19956 Sutton Falls Dr | 0.08mi | 3/2.0 | 1,326 (+3%) | 3mo | $199,900 | $151 | 89 |
| 7114 Pheasant Grove Dr | 0.38mi | 3/2.0 | 1,230 (-5%) | 3mo | $227,000 | $185 | 72 |
| 7343 Village Lake Dr | 0.32mi | 3/2.5 | 1,350 (+5%) | 4mo | $212,900 | $158 | 72 |
| 19427 Elmtree Estates Dr | 0.49mi | 3/2.0 | 1,326 (+3%) | 1mo | $220,000 | $166 | 71 |
| 7351 Village Lake Dr | 0.33mi | 3/2.5 | 1,364 (+6%) | 4mo | $229,000 | $168 | 70 |
| 19407 Glenway Falls Dr | 0.55mi | 3/2.0 | 1,326 (+3%) | 2mo | $229,900 | $173 | 68 |
| 19822 Creston Cove Ct | 0.64mi | 3/2.0 | 1,303 (+1%) | 1mo | $210,000 | $161 | 67 |
| 6734 Prairie Village Dr | 0.62mi | 3/2.0 | 1,326 (+3%) | 0mo | $225,000 | $170 | 66 |
| 6727 Cypress Glades Dr | 0.62mi | 3/2.0 | 1,256 (-3%) | 4mo | $225,000 | $179 | 63 |
| 7303 Rising Brook Dr | 0.42mi | 3/2.0 | 1,157 (-10%) | 0mo | $205,000 | $177 | 63 |
| 7315 Prairie Village Dr | 0.48mi | 3/2.0 | 1,386 (+8%) | 5mo | $225,000 | $162 | 61 |
Match score weights: distance 35% · size 25% · config 20% · recency 20%. Top-matched comps best support the ARV.
Projected returns pro-forma
-3.0% appreciation · 0.0% rent growth · sell at horizon
- IRR
- -21.7%
- Equity multiple
- 0.27×
- Total profit
- $-40,140
- Equity at exit
- $29,448
- IRR
- -27.2%
- Equity multiple
- -0.08×
- Total profit
- $-59,816
- Equity at exit
- $17,076
Cash invested: $55,300 (down + closing). Projections, not guarantees.
Landlord ↔ Tenant lean methodology
- Overall (STATE)
- 87 Strongly Landlord-Friendly
- State Texas
- 87 Strongly Landlord-Friendly · R+5
- County
- — inherits STATE
- City
- — inherits STATE
ZIP-level market 77433
- Home prices YoY
- -28.5%
- Rents YoY
- -1.3%
- Active inventory
- 2034
- Price-to-rent
- 8.4×
Monthly cashflow live
- Estimated rent
- $1,968 high interval (Pro) →
- Mortgage (P&I)
- −$1,036
- Tax from tax record
- −$437 /mo · $5,248/yr
- Insurance
- −$82
- HOA
- −$39
- Vacancy / Maint / Mgmt
- −$413
- Net cashflow
- $-40
Break-even live
UW: 25.0% down · 7.5% · 30yr · 1.5% tax · 5.0% vac · 8.0% maint · 8.0% mgmt
Financing live
Cash to close
- Down payment
- $49,375
- Closing costs
- $5,925
- Reserves months
- —
- Total cash needed
- —
Loan-product check · same deal, 3 products live
Conventional
25% down · 7.5% · 30yr
- Down + closing
- —
- Monthly P&I
- —
- Monthly cashflow
- —
- DSCR
- —
- Eligible?
- —
Personal DTI + credit; lowest rate.
DSCR
20% down · 8.5% · 30yr
- Down + closing
- —
- Monthly P&I
- —
- Monthly cashflow
- —
- DSCR
- —
- Eligible?
- —
No personal income docs; deal must DSCR.
Hard money
10% down · 12.0% · 12mo
- Down + closing
- —
- Monthly P&I
- —
- Monthly cashflow
- —
- DSCR
- —
- Eligible?
- —
Short-term bridge; refi at stabilization.
Rent comps 39 comps
| Address | Beds | Baths | Sqft | Rent | $/sqft | DOM | Units | Dist |
|---|---|---|---|---|---|---|---|---|
| 19917 Stoney Haven Dr Cypress, TX | 2.0 | 1.5 | 1060 | $1,579 | $1.49 | 44d | 1 | 0.15mi |
| 20123 Braley Ct Cypress, TX | 3.0 | 2.5 | 1726 | $2,036 | $1.18 | 4d | 1 | 0.25mi |
| 19715 Swan Valley Dr Cypress, TX | 3.0 | 2.0 | 1380 | $1,886 | $1.37 | 44d | 1 | 0.43mi |
| 19442 Elmtree Estates Dr Katy, TX | 3.0 | 2.0 | 1735 | $1,776 | $1.02 | 13d | 1 | 0.45mi |
| 19943 Crested Hill Ln Cypress, TX | 3.0 | 2.0 | 1204 | $1,621 | $1.35 | 7d | 1 | 0.53mi |
| 20126 Breezy Oak Ct Cypress, TX | 3.0 | 2.0 | 1667 | $2,100 | $1.26 | 4d | 1 | 0.54mi |
| 19434 Glenway Falls Dr Katy, TX | 3.0 | 2.0 | 1326 | $1,800 | $1.36 | 44d | 1 | 0.54mi |
| 20978 Farm to Market Road 529 Cypress, TX | 2.0 | 2.0 | 1025 | $1,725 | $1.68 | 44d | 1 | 0.56mi |
| 20978 Farm to Market Road 529 Unit SWFS2 Cypress, TX | 2.0 | 2.0 | 1025 | $1,725 | $1.68 | 3d | 1 | 0.56mi |
| 6810 N Fry Rd Katy, TX | 1.0–3.0 | 1.0–3.0 | 1151 | $2,683 | $2.33 | 2d | 56 | 0.64mi |
| 7850 Maverick Trace Ln Cypress, TX | 3.0 | 3.0 | 1852 | $1,875 | $1.01 | 44d | 1 | 0.72mi |
| 19607 Buckland Park Dr Katy, TX | 3.0 | 2.0 | 1798 | $1,965 | $1.09 | 3d | 1 | 0.82mi |
| 6619 Rusty Ridge Ln Katy, TX | 3.0 | 2.5 | 1450 | $1,895 | $1.31 | 4d | 1 | 0.86mi |
| 20507 Barker Bend Ct Katy, TX | 3.0 | 2.0 | 1488 | $1,825 | $1.23 | 44d | 1 | 0.86mi |
| 20735 Dewberry Creek Ln Katy, TX | 4.0 | 2.0 | 1609 | $1,756 | $1.09 | 22d | 1 | 0.87mi |
| 19939 Longenbaugh Rd Cypress, TX | 1.0–2.0 | 1.0–2.0 | 933 | $2,105 | $2.26 | 2d | 15 | 0.90mi |
| 7310 Coconut Bay Dr Cypress, TX | 4.0 | 2.0 | 1620 | $2,307 | $1.42 | 44d | 1 | 0.94mi |
| 20211 Longenbaugh Rd Cypress, TX | 1.0–3.0 | 1.0–2.0 | 1065 | $2,506 | $2.35 | 2d | 27 | 0.94mi |
| 20217 Longenbaugh Rd Cypress, TX | 2.0 | 2.0 | 1112 | $1,565 | $1.41 | 44d | 1 | 1.00mi |
| 19638 Billineys Park Dr Katy, TX | 3.0 | 2.5 | 1752 | $1,750 | $1.00 | 20d | 1 | 1.02mi |
| 20634 Longenbaugh Rd Cypress, TX | 2.0 | 2.0 | 1018 | $1,775 | $1.74 | 24d | 1 | 1.02mi |
| 20634 Longenbaugh Rd Cypress, TX | 2.0 | 2.0 | 1018 | $1,775 | $1.74 | 44d | 1 | 1.02mi |
| 6502 Wellington Meadows Dr Katy, TX | 3.0 | 2.0 | 1416 | $1,500 | $1.06 | 13d | 1 | 1.02mi |
| 7323 Livery Ln Cypress, TX | 3.0 | 2.0 | 1516 | $1,780 | $1.17 | 22d | 1 | 1.04mi |
| 21054 Breezeway Cove Dr Bridgeland, TX | 3.0–4.0 | 2.5–3.5 | 1784 | $2,408 | $1.35 | 3d | 41 | 1.08mi |
| 18723 Lippizaner Dr Cypress, TX | 3.0 | 2.0 | 1274 | $1,750 | $1.37 | 7d | 1 | 1.10mi |
| 18723 Lippizaner Dr Cypress, TX | 3.0 | 2.0 | 1274 | $1,750 | $1.37 | 11d | 1 | 1.10mi |
| 21035 Carmel Valley Dr Katy, TX | 3.0 | 2.0 | 1431 | $1,791 | $1.25 | 24d | 1 | 1.12mi |
| 21038 Treasure Gate Ln Cypress, TX | 4.0 | 2.5 | 1804 | $2,676 | $1.48 | 44d | 1 | 1.18mi |
| 21054 Montego Breeze Ln Cypress, TX | 3.0–5.0 | 2.0–3.5 | 1935 | $2,199 | $1.14 | 13d | 21 | 1.23mi |
| 6506 Garden Canyon Dr Katy, TX | 3.0 | 2.0 | 1842 | $1,895 | $1.03 | 22d | 1 | 1.25mi |
| 19299 W Little York Rd Unit ACS2 Katy, TX | 2.0 | 2.0 | 1112 | $1,984 | $1.78 | 44d | 1 | 1.27mi |
| 18531 Lippizaner Dr Cypress, TX | 4.0 | 2.0 | 1692 | $1,799 | $1.06 | 22d | 1 | 1.28mi |
| 19501 W Little York Rd Katy, TX | 2.0 | 2.0 | 990 | $1,250 | $1.26 | 44d | 1 | 1.28mi |
| 19501 W Little York Rd Katy, TX | 2.0 | 2.0 | 990 | $1,250 | $1.26 | 24d | 1 | 1.28mi |
| 21235 Catalina Palm Dr Cypress, TX | 4.0 | 2.0 | 1756 | $2,600 | $1.48 | 44d | 1 | 1.29mi |
| 20967 Young Meadows Way Katy, TX | 3.0 | 2.0 | 1256 | $1,795 | $1.43 | 7d | 1 | 1.39mi |
| 6402 Wild River Dr Katy, TX | 3.0 | 2.0 | 1572 | $2,091 | $1.33 | 3d | 1 | 1.44mi |
| 8357 Fry Rd Unit FCC Cypress, TX | 2.0 | 2.0 | 1018 | $1,775 | $1.74 | 11d | 1 | 1.48mi |
HOA detail
- Monthly dues
- $39 · $468/yr
- Likely covers
- water
Listing history 14 events
-
2026-06-18days on market $197,500 Pending 17 DOM
-
2026-06-17days on market $197,500 Pending 16 DOM
-
2026-06-16days on market $197,500 Pending 15 DOM
-
2026-06-16status $197,500 Pending 14 DOM
-
2026-06-15days on market $197,500 Active 14 DOM
-
2026-06-13days on market $197,500 Active 12 DOM
-
2026-06-13days on market $197,500 Active 11 DOM
-
2026-06-09days on market $197,500 Active 8 DOM
-
2026-06-08days on market $197,500 Active 7 DOM
-
2026-06-07days on market $197,500 Active 6 DOM
-
2026-06-04days on market $197,500 Active 3 DOM
-
2026-06-03days on market $197,500 Active 2 DOM
-
2026-06-02remarks 699-char remark
-
2026-06-02$197,500 Active 1 DOM
ⓘ Source: listings_history table (triggers on properties + properties_extension) + one-shot
backfill from property_details.listing_events for pre-trigger history.
Tax reassessment forecast TX · Resets to sale price
- Current annual tax
- $5,248 · $437/mo
- Projected year-2 tax
- $5,248 · $437/mo
- Expected delta
- $0/yr ($0/mo · 0.0%)
ⓘ Screening estimate from a state-policy table — verify with the county assessor before closing.
Climate risk First Street
- Flood 6/10 Major FEMA zone X (unshaded) · 67% chance over 30 yrs
- Wildfire 3/10 Moderate
- Heat 9/10 Extreme 7 d/yr ≥110°F today · 24 d/yr by 30 yrs out
- Wind 8/10 Severe 99% chance of damaging wind over 30 yrs
- Air quality 2/10 Low 2 unhealthy d/yr today · 2 by 30 yrs out
Nearby sold comps map
Loading sold comps map…
Walkable amenities ~0.75 mi
Loading nearby amenities…
Taxation est. · year 1
- Rental income
- $23,612
- − Mortgage interest
- −$11,063
- − Property taxes
- −$5,248
- − Insurance
- −$988
- − Repairs & maintenance
- −$1,889
- − Management
- −$1,889
- − HOA
- −$468
- − Depreciation
- −$5,745
- Taxable loss
- −$3,678
- Est. tax savings @ 24.0%
- +$883
- After-tax cash flow
- $404/yr
For passive investors: Depreciation is non-cash, so a rental often shows a tax loss while cash-flowing — sheltering income. Rental losses are passive: they offset passive income freely, and up to $25,000/yr can offset ordinary (W-2) income if you actively participate and your MAGI is under $100k (phasing out to $0 by $150k); unused losses carry forward. On sale, claimed depreciation is recaptured at up to 25%, and gains may owe capital-gains tax (a 1031 exchange can defer both). Figures are a year-1 estimate at your 24.0% rate — not tax advice; consult a CPA.
Schools (NCES district)
- District
- Cypress-Fairbanks ISD
- NCES district ID
- 4816110
- Math proficiency
- 45% ▼ -12.00%
- Reading proficiency
- 52% ▼ -2.00%
- Median HH income
- $72,025
- Composite
- 43.63/100
- National rank
- #2968
- State rank
- #161 of 826 in TX
Livability — Houston
- Score
- 74/100
- State rank
- #184
- US rank
- #4771
Category grades
Schools grade is shown separately in the Schools card above.
Census & demographics
- County
- Harris County · 4,702,590 people
- City population
- 3,226,434
- Metro
- Houston-The Woodlands-Sugar Land, TX
- Population (ZIP)
- 116,550
- Household income
- $143,934
- Rent vs Own
- Severe rent burden
- 1700.0
Population outlook (Harris County) Hauer SSP2
- Today (2025)
- 5,571,493 people
- By 2030
- 6,089,821 · +9.3%
- By 2040
- 7,142,806 · +28.2%
- By 2050
- 8,185,864 · +46.9%
- By 2075
- 10,574,329 · +89.8%
- By 2100
- 12,109,958 · +117.4%
Race, ethnicity, and origin ACS 2023
- Neighborhood character
- Highly diverse neighborhood (Simpson 0.73)
- Race & ethnicity
- White 39% Hispanic / Latino 27% Black 17% Two or more races 14% Asian 13%
- Hispanic origin (detail)
- Mexican 16%
- Common ancestry
- Lithuanian 2% Romanian 1% Italian 1%
- Foreign-born
- 21% · Canada, Vietnam, China
- Languages at home
- 66% English-only · Spanish 19% Other Indo-European 4% Vietnamese 4%
Political lean MEDSL · Harris
- 2024 margin
- Lean D (+5.5) · D 52.0% · R 46.4% · Other 1.6%
- 2008→2024 swing
- +3.9pp toward D · 2008: 1.6pp · 2024: 5.5pp
- All cycles
- 2024: D+5.5 2020: D+13.3 2016: D+12.4 2012: D+0.1 2008: D+1.6
Not yet ingested
- Civics
- —
Market trends
- HPI YoY
- ▼ -87.83%
- Current HPI
- 220.2136
- Rent YoY
- ▼ -1.27%
- Metro
- Houston-The Woodlands-Sugar Land, TX
- State GDP YoY
- ▲ 3.95%
- F500 in state
- 110
Industry mix (Fortune 500 HQ in TX)
| Industry | F500 HQs | Revenue |
|---|---|---|
| Energy | 16 | $1,198B |
|
||
| Technology | 5 | $198B |
|
||
| Engineering / Construction | 4 | $72B |
|
||
| Energy Services | 3 | $60B |
|
||
| Utilities | 3 | $41B |
|
||
| Healthcare | 2 | $330B |
|
||
Price history
+433.8% since first listed3 events — show timeline
- 2026-06-01 Listed $197,500 HARMLS
- 1998-05-07 Sold (Public Records) — Public Records
- 1998-05-01 Sold (Public Records) $37,000 Public Records
Property tax history
+7.4%/yrLatest (2025): $5,248 · +0.8% YoY. Source: county tax records.
Cash-flow waterfall
monthlySold comps — $/sqft
last 12 mo · ≤1 miLoading sold comps…