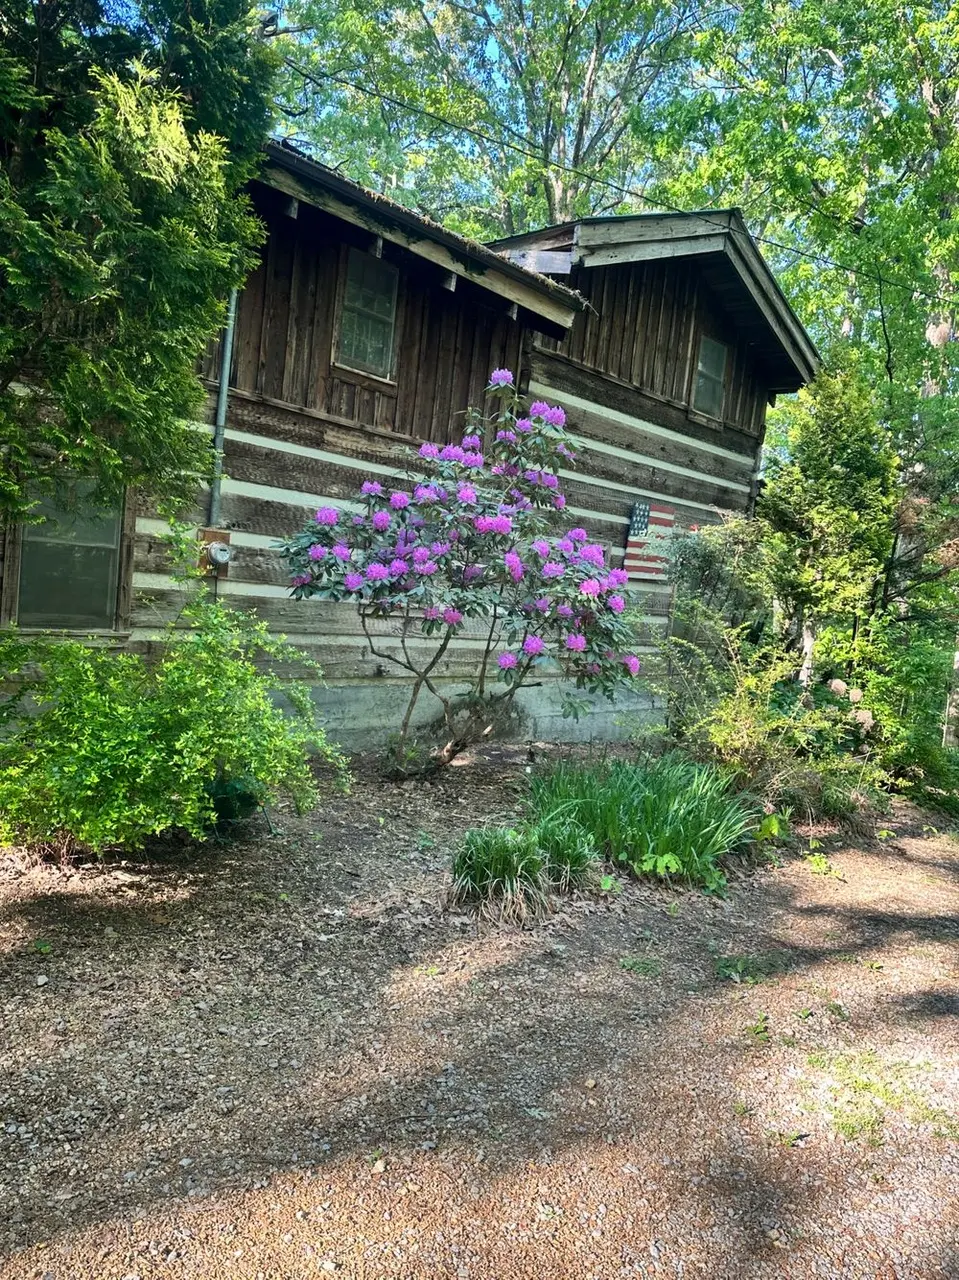
2750 Branch Rd
Tellico Village, TN 37774
$259,000C+
3 bd · 2.0 ba ·
1,760 sqft ·
Built 1985
· SingleFamily
· Under Contract
Cashflow @ list (25.0% down · 7.5%)
Estimated rent
$2,889/mo
Mortgage (P&I)
−$1,358
Tax + insurance
−$432
HOA
−$0
Vac / Maint / Mgmt
−$607
Net cashflow
$492/mo
Annual
$5,909/yr
Cap rate
8.57%
Cash-on-cash
8.15%
DSCR
1.36
1% rule
1.12%
Cash to close
$72,520
Investor read
- This is a 3-bed/2.0-bath single-family listed at $259k.
- At list price, monthly cash flow is $492 ($6k/yr) — positive.
- The deal already cash-flows at list — no discount required.
- Meets the 1% rule at list price ($3k rent vs $259k).
- Only 0 days on market — expect competitive offers; lowballing is unlikely to land.
- Local home prices are declining (-3.0%/yr); year-one equity from $2k of loan paydown is wiped out by about $8k of value loss. Plan a longer hold.
- Location reads 58/100 on livability (#303 in TN) — a working-class tenant base; expect higher turnover. Strengths: employment A+, crime A, housing B+; Watch: amenities F, commute F, cost of living F.
- Loudon County (rural): math 39% / reading 35% proficiency, ranked #18 of 139 in TN (top 13%) — families likely to look elsewhere, expect single-tenant / working-renter base with shorter leases.
- Market conditions: 436 active listings in the ZIP; 5 comparable units currently listed for rent nearby; rentals lingering (median 44d on market — plan ~5-8 weeks vacancy on turnover, expect pricing pressure); 60% of comp listings sitting > 30 days — soft ceiling on asking rent; solid renter incomes; 608 units permitted in Loudon County in 2024 (0 in 5+ unit buildings).
- Loudon County population projected at +17% by 2050 — long-run rental-demand tailwind backs the buy-and-hold thesis.
- 6 sale attempts since 20y ago with the ask held roughly flat each time — persistent listings suggest the price (not the market) is what's stuck; bring a comps-based counter.
- Current owner paid $100k; list at $259k implies a 159% gain — meaningful room to come down on a strong offer.
- Climate carrying-cost: moderate wildfire risk; extreme-heat days projected 7→18/yr by 2055 (HVAC capex compounding) — expect insurance premiums to compound above CPI over the hold.
- Cap rate 8.6% vs local median 2.3% in Tellico Village — top-decile yield for the area; either an underpriced asset or a hidden risk that comps aren't pricing in. Stress-test before assuming the spread holds.
- This rent runs 40% of the median local income ($88k/yr) — at the standard rent-burdened threshold; future hikes will face affordability resistance.
Questions for listing agent
- Is there a deadline driving the sale (1031 exchange, divorce, estate, relocation)? That informs how much negotiation room exists.
- What's the average days-on-market for RENTAL listings here right now (not sales)? A rising rental-DOM trend means longer vacancies and softer asking-rent achievability than the comps imply.
- What's the recent tenant-quality profile in this submarket — average credit score on applications, eviction rate, late-payment / NSF rate, and stable-employment percentage? A property-management company in the area should have these aggregated.
- How much new for-sale + rental construction is in the pipeline within 1–3 miles? Heavy new supply typically softens prices + rents 12–24 months out; constrained supply supports both.
CashFlowRE · CFR-03W567DTHGP37F
· Data 2 weeks ago
cashflowre.app · 2026-05-29