2750 Branch Rd · Tellico Village, TN
Flood risk 1/10 · Minimal
- FEMA flood zone
- X (unshaded)
- Chance of flooding over 30 yrs
- 0.0%
- Est. flood insurance / yr
- $507 – $1,088
Fire risk 5/10 · Moderate
- Est. fire insurance / yr
- $949 – $1,763
Heat risk 5/10 · Moderate
- Hot days now (above 104°F)
- 7 days/yr
- Hot days in 30 yrs
- 18 days/yr
Wind risk 2/10 · Minimal
- Chance of severe wind over 30 yrs
- 0.0%
Air-quality risk 3/10 · Minor
- Unhealthy air days now
- 2 days/yr
- Unhealthy air days in 30 yrs
- 2 days/yr
Risk factors via First Street. Map © Google.
Why this score? — see what drove the C+ grade
The composite is a weighted blend of 9 inputs, each scored 0–100. Each bar is that input's sub-score; the figure is the points it added to the 100-point composite (weight × sub-score).
- Cash flow +23.7/30.0
- ARV discount +15.0/15.0
- DSCR +7.6/10.0
- 1% rule +6.2/10.0
- Schools +3.2/10.0
- Livability +2.9/5.0
- Rent growth +2.5/5.0
- Condition / age +2.5/5.0
- Appreciation +0.0/10.0
$259,000
🖨 Deal sheet 📄 Offer letter ✓ Due diligence
Listing remarks MLS
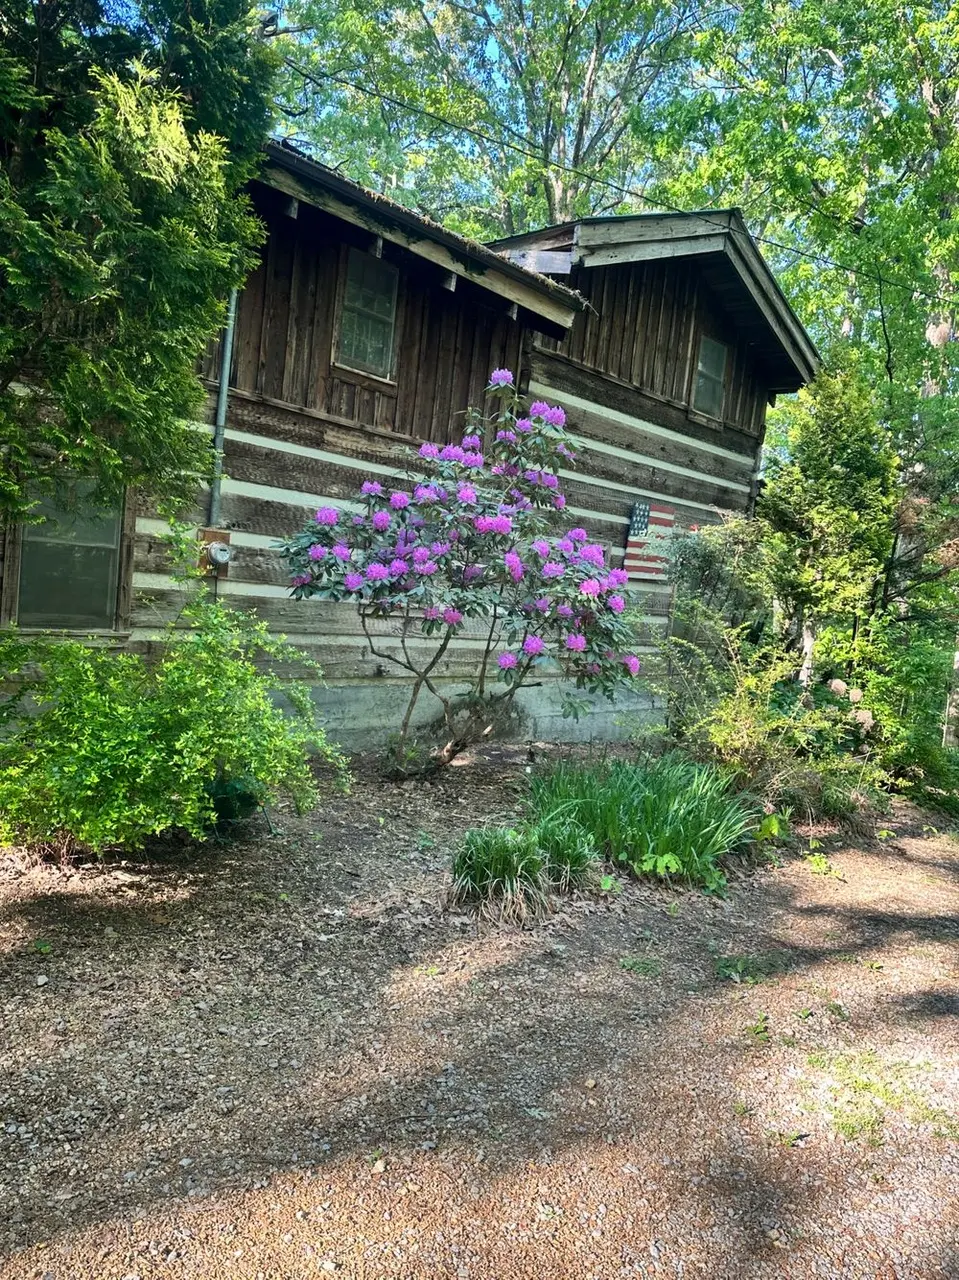
A getaway to your private log cabin with 3 bedrooms and 2 baths! Living room is open with stone fireplace. All data (incl sq ft) taken from prev MLS, Tax Records or current deed. Property offered as is with all faults; no post-closing repairs or payments will be made for any reason. Purchaser must execute a copy of client's required Contract and Addenda.
Key facts
- 1.04 acre lot
- Built 1985
Property features AI
Exterior
- Home design: House
- Construction: 1,760 total living area
- Exterior features: Situated on a 1.04-acre lot
Neighborhood map
What this means for you Summary
Snapshot
- This is a 3-bed/2.0-bath single-family listed at $259k.
Deal economics
- At list price, monthly cash flow is $492 ($6k/yr) — positive.
- The deal already cash-flows at list — no discount required.
- Meets the 1% rule at list price ($3k rent vs $259k).
- Cap rate 8.6% vs local median 2.3% in Tellico Village — top-decile yield for the area; either an underpriced asset or a hidden risk that comps aren't pricing in. Stress-test before assuming the spread holds.
Location & tenants
- Location reads 58/100 on livability (#303 in TN) — a working-class tenant base; expect higher turnover. Strengths: employment A+, crime A, housing B+; Watch: amenities F, commute F, cost of living F.
- Loudon County (rural): math 39% / reading 35% proficiency, ranked #18 of 139 in TN (top 13%) — families likely to look elsewhere, expect single-tenant / working-renter base with shorter leases.
- Market conditions: 436 active listings in the ZIP; 5 comparable units currently listed for rent nearby; rentals lingering (median 44d on market — plan ~5-8 weeks vacancy on turnover, expect pricing pressure); 60% of comp listings sitting > 30 days — soft ceiling on asking rent; solid renter incomes; 608 units permitted in Loudon County in 2024 (0 in 5+ unit buildings).
- This rent runs 40% of the median local income ($88k/yr) — at the standard rent-burdened threshold; future hikes will face affordability resistance.
Forward outlook
- Local home prices are declining (-3.0%/yr); year-one equity from $2k of loan paydown is wiped out by about $8k of value loss. Plan a longer hold.
- Loudon County population projected at +17% by 2050 — long-run rental-demand tailwind backs the buy-and-hold thesis.
Negotiation context
- Only 0 days on market — expect competitive offers; lowballing is unlikely to land.
- 6 sale attempts since 20y ago with the ask held roughly flat each time — persistent listings suggest the price (not the market) is what's stuck; bring a comps-based counter.
- Current owner paid $100k; list at $259k implies a 159% gain — meaningful room to come down on a strong offer.
Risks & watch-outs
- Climate carrying-cost: moderate wildfire risk; extreme-heat days projected 7→18/yr by 2055 (HVAC capex compounding) — expect insurance premiums to compound above CPI over the hold.
Questions for the listing agent
- Is there a deadline driving the sale (1031 exchange, divorce, estate, relocation)? That informs how much negotiation room exists.
- What's the average days-on-market for RENTAL listings here right now (not sales)? A rising rental-DOM trend means longer vacancies and softer asking-rent achievability than the comps imply.
- What's the recent tenant-quality profile in this submarket — average credit score on applications, eviction rate, late-payment / NSF rate, and stable-employment percentage? A property-management company in the area should have these aggregated.
- How much new for-sale + rental construction is in the pipeline within 1–3 miles? Heavy new supply typically softens prices + rents 12–24 months out; constrained supply supports both.
Investment metrics
- 1% rule
- 1.12% ✓
- Cap rate
- 8.57%
- Cash-on-cash
- 8.15%
- DSCR
- 1.36
- GRM
- 7.5
CMA / ARV
- ARV (on-the-fly)
- $413,600
- Comps found
- 2
Show comp detail 2 sales within ~0.75 mi
| Address | Dist | Beds/Ba | Sqft | Sold | Price | $/sf | Match |
|---|---|---|---|---|---|---|---|
| 105 Poteau Trce | 0.67mi | 3/2.5 | 1,754 (-0%) | 11mo | $325,200 | $185 | 57 |
| 137 Chahyga Way | 0.74mi | 3/2.0 | 1,980 (+12%) | 22mo | $465,000 | $235 | 26 |
Match score weights: distance 35% · size 25% · config 20% · recency 20%. Top-matched comps best support the ARV.
Projected returns pro-forma
-3.0% appreciation · 3.0% rent growth · sell at horizon
- IRR
- -3.9%
- Equity multiple
- 0.85×
- Total profit
- $-10,566
- Equity at exit
- $38,618
- IRR
- 5.8%
- Equity multiple
- 1.43×
- Total profit
- $31,358
- Equity at exit
- $22,394
Cash invested: $72,520 (down + closing). Projections, not guarantees.
Landlord ↔ Tenant lean methodology
- Overall (STATE)
- 87 Strongly Landlord-Friendly
- State Tennessee
- 87 Strongly Landlord-Friendly · R+13
- County
- — inherits STATE
- City
- — inherits STATE
ZIP-level market 37774
- Home prices YoY
- -12.8%
- Active inventory
- 436
- Price-to-rent
- 7.5×
Monthly cashflow live
- Estimated rent
- $2,889 high interval (Pro) →
- Mortgage (P&I)
- −$1,358
- Tax est. 1.5%
- −$324 /mo · $3,885/yr
- Insurance
- −$108
- HOA
- −$0
- Vacancy / Maint / Mgmt
- −$607
- Net cashflow
- $492
Break-even live
UW: 25.0% down · 7.5% · 30yr · 1.5% tax · 5.0% vac · 8.0% maint · 8.0% mgmt
Financing live
Cash to close
- Down payment
- $64,750
- Closing costs
- $7,770
- Reserves months
- —
- Total cash needed
- —
Loan-product check · same deal, 3 products live
Conventional
25% down · 7.5% · 30yr
- Down + closing
- —
- Monthly P&I
- —
- Monthly cashflow
- —
- DSCR
- —
- Eligible?
- —
Personal DTI + credit; lowest rate.
DSCR
20% down · 8.5% · 30yr
- Down + closing
- —
- Monthly P&I
- —
- Monthly cashflow
- —
- DSCR
- —
- Eligible?
- —
No personal income docs; deal must DSCR.
Hard money
10% down · 12.0% · 12mo
- Down + closing
- —
- Monthly P&I
- —
- Monthly cashflow
- —
- DSCR
- —
- Eligible?
- —
Short-term bridge; refi at stabilization.
Rent comps 5 comps
| Address | Beds | Baths | Sqft | Rent | $/sqft | DOM | Units | Dist |
|---|---|---|---|---|---|---|---|---|
| 507 Cimarron Cir Unit 1 Loudon, TN | 3.0 | 2.5 | 1827 | $2,925 | $1.60 | 44d | 1 | 0.62mi |
| 304 Chota View Pl Unit 1 Loudon, TN | 3.0 | 2.0 | 1504 | $2,650 | $1.76 | 44d | 1 | 0.73mi |
| 308 Chota View Pl Loudon, TN | 3.0 | 2.0 | 1504 | $2,350 | $1.56 | 44d | 1 | 0.75mi |
| 235 Oostanali Way Loudon, TN | 3.0 | 2.0 | 1637 | $2,500 | $1.53 | 23d | 1 | 0.99mi |
| 111 Daleyuhski Way Loudon, TN | 2.0 | 2.0 | 1860 | $2,650 | $1.42 | 14d | 1 | 1.49mi |
Listing history 2 events
-
2026-06-05remarks 199-char remark
-
2026-06-05$259,000 Under Contract
ⓘ Source: listings_history table (triggers on properties + properties_extension) + one-shot
backfill from property_details.listing_events for pre-trigger history.
Climate risk First Street
- Flood 1/10 Low FEMA zone X (unshaded) · 0% chance over 30 yrs
- Wildfire 5/10 Major
- Heat 5/10 Major 7 d/yr ≥104°F today · 18 d/yr by 30 yrs out
- Wind 2/10 Low 0% chance of damaging wind over 30 yrs
- Air quality 3/10 Moderate 2 unhealthy d/yr today · 2 by 30 yrs out
Nearby sold comps map
Loading sold comps map…
Walkable amenities ~0.75 mi
Loading nearby amenities…
Taxation est. · year 1
- Rental income
- $34,667
- − Mortgage interest
- −$14,508
- − Property taxes
- −$3,885
- − Insurance
- −$1,295
- − Repairs & maintenance
- −$2,773
- − Management
- −$2,773
- − Depreciation
- −$7,535
- Taxable income
- $1,898
- Est. tax owed @ 24.0%
- −$456
- After-tax cash flow
- $5,453/yr
For passive investors: Depreciation is non-cash, so a rental often shows a tax loss while cash-flowing — sheltering income. Rental losses are passive: they offset passive income freely, and up to $25,000/yr can offset ordinary (W-2) income if you actively participate and your MAGI is under $100k (phasing out to $0 by $150k); unused losses carry forward. On sale, claimed depreciation is recaptured at up to 25%, and gains may owe capital-gains tax (a 1031 exchange can defer both). Figures are a year-1 estimate at your 24.0% rate — not tax advice; consult a CPA.
Schools (NCES district)
- District
- Loudon County
- NCES district ID
- 4702520
- Math proficiency
- 39% ▼ -13.00%
- Reading proficiency
- 35% ▼ -4.00%
- Median HH income
- $54,201
- Composite
- 32.43/100
- National rank
- #5724
- State rank
- #18 of 139 in TN
Livability — Tellico Village
- Score
- 58/100
- State rank
- #303
- US rank
- #20785
Category grades
Schools grade is shown separately in the Schools card above.
Census & demographics
- County
- Loudon County · 54,472 people
- Metro
- Knoxville, TN
- Population (ZIP)
- 21,784
- Household income
- $87,718
- Rent vs Own
- Severe rent burden
- 200.0
Population outlook (Loudon County) Hauer SSP2
- Today (2025)
- 55,364 people
- By 2030
- 57,414 · +3.7%
- By 2040
- 61,216 · +10.6%
- By 2050
- 64,846 · +17.1%
- By 2075
- 75,829 · +37.0%
- By 2100
- 85,693 · +54.8%
Race, ethnicity, and origin ACS 2023
- Neighborhood character
- Predominantly White (87%)
- Race & ethnicity
- White 87% Hispanic / Latino 9% Two or more races 6% Asian 2% Black 1%
- Hispanic origin (detail)
- Mexican 6%
- Common ancestry
- Serbian 3% Romanian 2% Slovak 2%
- Foreign-born
- 7% · Canada
- Languages at home
- 93% English-only · Spanish 6%
Political lean MEDSL · Loudon
- 2024 margin
- Solid R (+53.0) · D 23.0% · R 76.0% · Other 1.1%
- 2008→2024 swing
- -9.0pp toward R · 2008: -44.0pp · 2024: -53.0pp
- All cycles
- 2024: R+53.0 2020: R+50.3 2016: R+54.4 2012: R+52.8 2008: R+44.0
Not yet ingested
- Civics
- —
Market trends
- HPI YoY
- ▼ -47.04%
- Current HPI
- 320.0874
- Rent YoY
- —
- Metro
- Knoxville, TN
- State GDP YoY
- ▲ 2.78%
- F500 in state
- 22
Industry mix (Fortune 500 HQ in TN)
| Industry | F500 HQs | Revenue |
|---|---|---|
| Healthcare | 3 | $91B |
|
||
| Retail | 3 | $72B |
|
||
| Transportation / Logistics | 1 | $88B |
|
||
| Paper / Packaging | 1 | $19B |
|
||
| Insurance | 1 | $13B |
|
||
| Energy | 1 | $12B |
|
||
Price history
+107.2% since first listed9 events — show timeline
- 2026-06-04 Listed — ForSaleByOwner.com
- 2026-06-04 Listed $259,000 ForSaleByOwner.com
- 2014-02-28 Sold (MLS) $100,000 Knoxville MLS
- 2013-12-13 Listed $100,000 Knoxville MLS
- 2013-02-11 Listed $179,900 Knoxville MLS
- 2011-11-11 Listed $209,900 Knoxville MLS
- 2006-10-30 Sold (Public Records) $113,900 Public Records
- 2006-10-23 Sold (MLS) $113,900 Knoxville MLS
- 2006-08-23 Listed $125,000 Knoxville MLS
Property tax history
+0.8%/yrLatest (2025): $501 · +0.0% YoY. Source: county tax records.
Cash-flow waterfall
monthlySold comps — $/sqft
last 12 mo · ≤1 miLoading sold comps…