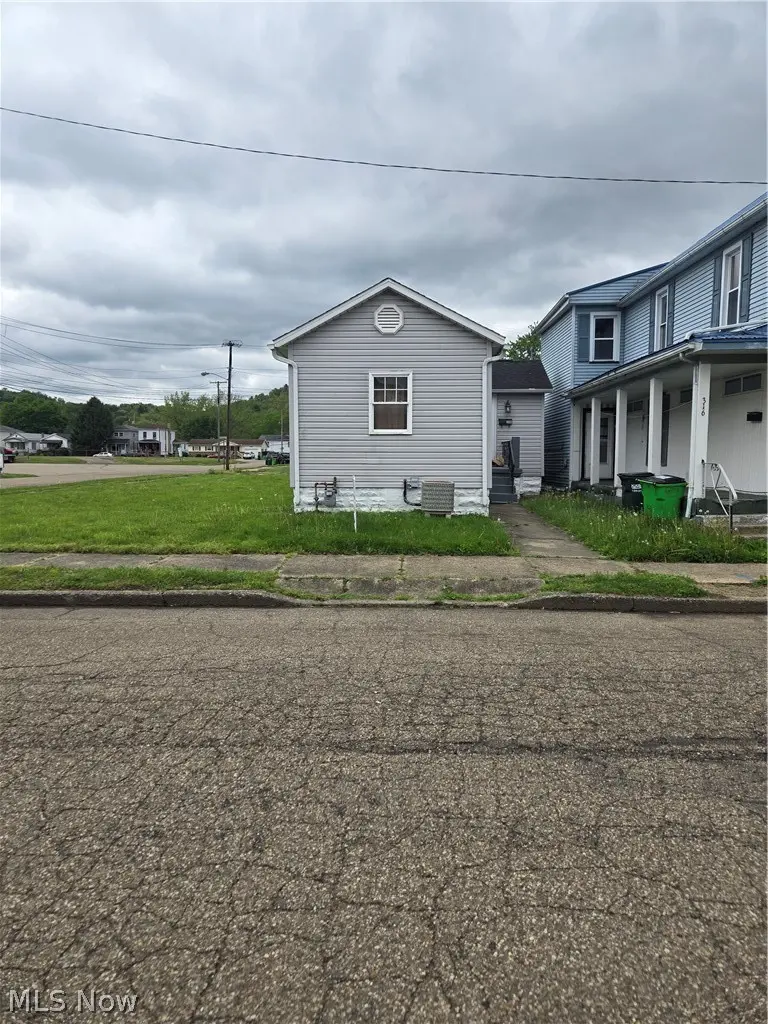
318 Bank St
Dennison, OH 44621
$89,900B-
1 bd · 1.0 ba ·
637 sqft ·
Built 1884
· SingleFamily
· Active
· 139 DOM
Cashflow @ list (25.0% down · 7.5%)
Estimated rent
$1,121/mo
Mortgage (P&I)
−$471
Tax + insurance
−$83
HOA
−$0
Vac / Maint / Mgmt
−$235
Net cashflow
$331/mo
Annual
$3,970/yr
Cap rate
10.71%
Cash-on-cash
15.77%
DSCR
1.70
1% rule
1.25%
Cash to close
$25,172
Investor read
- This is a 1-bed/1.0-bath single-family listed at $90k.
- At list price, monthly cash flow is $331 ($4k/yr) — positive.
- The deal already cash-flows at list — no discount required.
- Meets the 1% rule at list price ($1k rent vs $90k).
- It's been on market 139 days — a 12% lower offer ($79k) is reasonable based on typical stale-listing flexibility.
- Recommended offer: $79k (12.0% below list) — sets the bar for market timing.
- Local home prices are declining (-3.0%/yr); year-one equity from $622 of loan paydown is wiped out by about $3k of value loss. Plan a longer hold.
- Location reads 65/100 on livability (#726 in OH) — a middle-class / working-renter tenant base. Strengths: crime A+, cost of living A+, housing A+; Watch: amenities F, commute F, employment D-.
- Claymont City (town): math 47% / reading 51% proficiency, ranked #467 of 656 in OH (top 71%) — families likely to look elsewhere, expect single-tenant / working-renter base with shorter leases.
- Zoned schools: Claymont Elementary School (math 77% / reading 52%, grade B, #522 of 1,584 statewide, top 36%, 268 students, 0% FRL); Claymont Middle School (math 38% / reading 54%, grade D+, #464 of 654 statewide, top 71%, 392 students, 0% FRL); Claymont High School (math 32% / reading 52%, grade F, #497 of 781 statewide, top 66%, 392 students, 0% FRL) — zoned schools average 0% FRL vs 51% district-wide (51 pts lower); this property's tenant base skews higher-income than the district average.
- Watch-outs: built in 1884 — expect roof / HVAC / electrical / plumbing capex.
- Market conditions: 22 active listings in the ZIP; 244 units permitted in Tuscarawas County in 2024 (0 in 5+ unit buildings).
- Tuscarawas County population projected to shrink 10% by 2050 — rents likely to lag national; underwrite the cash flow, not the appreciation.
- 5 sale attempts since 23y ago; this cycle's ask has dropped $5k (5%) from the opening price — seller is motivated, your offer sets the floor, not the list.
- Current owner paid $72k; 24% above their basis — modest negotiation headroom, anchor on the comps not their cost.
- At projected returns (-3.0% appreciation + 3.0% rent growth), your $25k cash investment doubles in ~8 years — after that, you're playing with house money.
Questions for listing agent
- It's been on market 139 days. Have you received any prior offers? Is the seller open to a 12% concession, seller financing, or rate buy-down credit?
- Built in 1884 — when were the roof, HVAC, electrical panel, plumbing, and water heater last replaced?
- Why hasn't it sold? Are there any deal-killer items the seller is aware of (foundation, flood, title, zoning, code violations)?
- Is there a deadline driving the sale (1031 exchange, divorce, estate, relocation)? That informs how much negotiation room exists.
- Schools are B-rated — typically a magnet for longer-tenancy family renters. What's the average tenant stay here, and is there a school-zone premium baked into asking?
- What's the average days-on-market for RENTAL listings here right now (not sales)? A rising rental-DOM trend means longer vacancies and softer asking-rent achievability than the comps imply.
- What's the recent tenant-quality profile in this submarket — average credit score on applications, eviction rate, late-payment / NSF rate, and stable-employment percentage? A property-management company in the area should have these aggregated.
- How much new for-sale + rental construction is in the pipeline within 1–3 miles? Heavy new supply typically softens prices + rents 12–24 months out; constrained supply supports both.
CashFlowRE · CFR-04N3T306WV6SKY
· Data 20 h ago
cashflowre.app · 2026-05-29