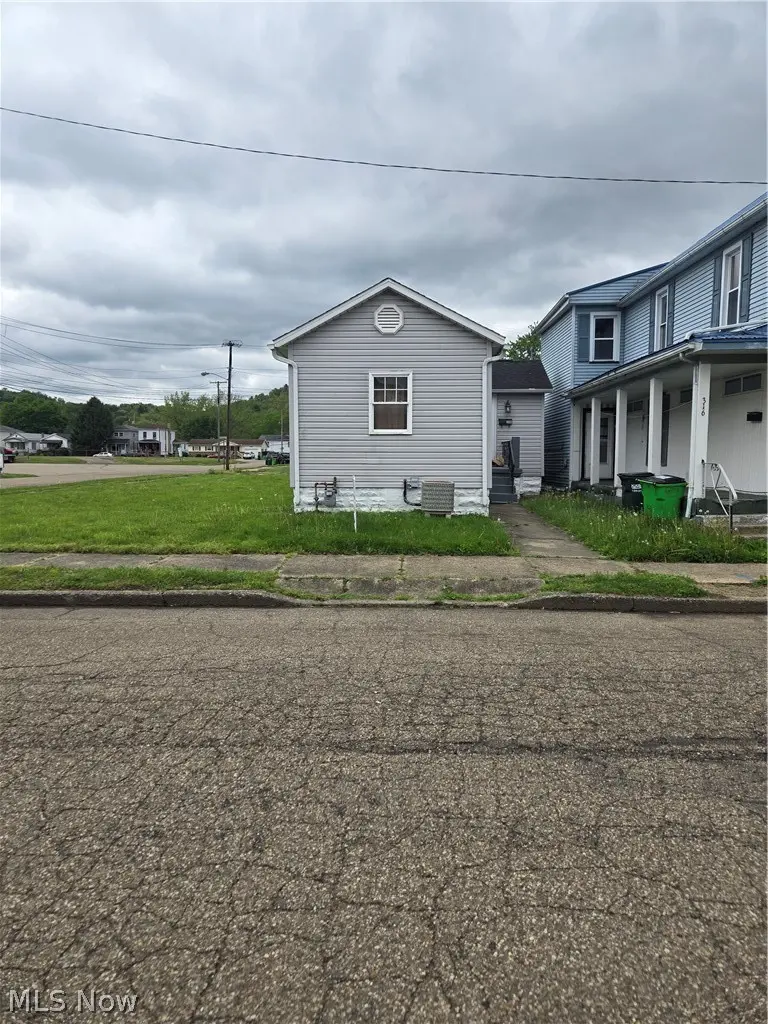
318 Bank St · Dennison, OH
Flood risk 1/10 · Minimal
- FEMA flood zone
- X (unshaded)
- Chance of flooding over 30 yrs
- 0.0%
- Est. flood insurance / yr
- $473 – $860
Fire risk 1/10 · Minimal
- Est. fire insurance / yr
- $713 – $1,323
Heat risk 4/10 · Minor
- Hot days now (above 99°F)
- 7 days/yr
- Hot days in 30 yrs
- 18 days/yr
Wind risk 1/10 · Minimal
- Chance of severe wind over 30 yrs
- —
Air-quality risk 2/10 · Minimal
- Unhealthy air days now
- 1 days/yr
- Unhealthy air days in 30 yrs
- 2 days/yr
Risk factors via First Street. Map © Google.
Why this score? — see what drove the B- grade
The composite is a weighted blend of 9 inputs, each scored 0–100. Each bar is that input's sub-score; the figure is the points it added to the 100-point composite (weight × sub-score).
- Cash flow +29.8/30.0
- DSCR +10.0/10.0
- 1% rule +7.5/10.0
- ARV discount +6.2/15.0
- Schools +4.1/10.0
- Livability +3.2/5.0
- Rent growth +2.5/5.0
- Condition / age +2.5/5.0
- Appreciation +0.0/10.0
$89,900
🖨 Deal sheet (PDF) 📄 Offer letter ✓ Due diligence
Listing remarks MLS
Very well maintained cozy ranch. If you are looking to downsize or need an investment property. Main floor living with bedroom, living room, kitchen and bathroom. Kitchen leads to backdoor entryway with an area for coats and shoes. Basement has washer and dryer hook-up and lots of space for storage. Electric average $90/Gas average $50/Water average $60. HWT is rented. Appliances included are refrigerator and stove.
Key facts
- 3,249 sq ft lot
- Built 1884
- Listed 138 days
Neighborhood map
What this means for you Summary
Snapshot
- This is a 1-bed/1.0-bath single-family listed at $90k.
Deal economics
- At list price, monthly cash flow is $331 ($4k/yr) — positive.
- The deal already cash-flows at list — no discount required.
- Meets the 1% rule at list price ($1k rent vs $90k).
- Recommended offer: $79k (12.0% below list) — sets the bar for market timing.
Location & tenants
- Location reads 65/100 on livability (#726 in OH) — a middle-class / working-renter tenant base. Strengths: crime A+, cost of living A+, housing A+; Watch: amenities F, commute F, employment D-.
- Claymont City (town): math 47% / reading 51% proficiency, ranked #467 of 656 in OH (top 71%) — families likely to look elsewhere, expect single-tenant / working-renter base with shorter leases.
- Zoned schools: Claymont Elementary School (math 77% / reading 52%, grade B, #522 of 1,584 statewide, top 36%, 268 students, 0% FRL); Claymont Middle School (math 38% / reading 54%, grade D+, #464 of 654 statewide, top 71%, 392 students, 0% FRL); Claymont High School (math 32% / reading 52%, grade F, #497 of 781 statewide, top 66%, 392 students, 0% FRL) — zoned schools average 0% FRL vs 51% district-wide (51 pts lower); this property's tenant base skews higher-income than the district average.
- Market conditions: 22 active listings in the ZIP; 244 units permitted in Tuscarawas County in 2024 (0 in 5+ unit buildings).
Forward outlook
- Local home prices are declining (-3.0%/yr); year-one equity from $622 of loan paydown is wiped out by about $3k of value loss. Plan a longer hold.
- Tuscarawas County population projected to shrink 10% by 2050 — rents likely to lag national; underwrite the cash flow, not the appreciation.
- At projected returns (-3.0% appreciation + 3.0% rent growth), your $25k cash investment doubles in ~8 years — after that, you're playing with house money.
Negotiation context
- It's been on market 139 days — a 12% lower offer ($79k) is reasonable based on typical stale-listing flexibility.
- 5 sale attempts since 23y ago; this cycle's ask has dropped $5k (5%) from the opening price — seller is motivated, your offer sets the floor, not the list.
- Current owner paid $72k; 24% above their basis — modest negotiation headroom, anchor on the comps not their cost.
Risks & watch-outs
- Watch-outs: built in 1884 — expect roof / HVAC / electrical / plumbing capex.
Questions for the listing agent
- It's been on market 139 days. Have you received any prior offers? Is the seller open to a 12% concession, seller financing, or rate buy-down credit?
- Built in 1884 — when were the roof, HVAC, electrical panel, plumbing, and water heater last replaced?
- Why hasn't it sold? Are there any deal-killer items the seller is aware of (foundation, flood, title, zoning, code violations)?
- Is there a deadline driving the sale (1031 exchange, divorce, estate, relocation)? That informs how much negotiation room exists.
- Schools are B-rated — typically a magnet for longer-tenancy family renters. What's the average tenant stay here, and is there a school-zone premium baked into asking?
- What's the average days-on-market for RENTAL listings here right now (not sales)? A rising rental-DOM trend means longer vacancies and softer asking-rent achievability than the comps imply.
- What's the recent tenant-quality profile in this submarket — average credit score on applications, eviction rate, late-payment / NSF rate, and stable-employment percentage? A property-management company in the area should have these aggregated.
- How much new for-sale + rental construction is in the pipeline within 1–3 miles? Heavy new supply typically softens prices + rents 12–24 months out; constrained supply supports both.
Investment metrics
- 1% rule
- 1.25% ✓
- Cap rate
- 10.71%
- Cash-on-cash
- 15.77%
- DSCR
- 1.70
- GRM
- 6.7
CMA / ARV
- ARV (median comp)
- $87,342
- List price
- $89,900
- Delta
- 2.93%
- Verdict
- FAIR
- Comps
- 6 within 1.0 mi
Projected returns pro-forma
-3.0% appreciation · 3.0% rent growth · sell at horizon
- IRR
- 6.6%
- Equity multiple
- 1.26×
- Total profit
- $6,479
- Equity at exit
- $13,404
- IRR
- 15.9%
- Equity multiple
- 2.30×
- Total profit
- $32,676
- Equity at exit
- $7,773
Cash invested: $25,172 (down + closing). Projections, not guarantees.
Landlord ↔ Tenant lean methodology
- Overall (STATE)
- 73 Landlord-Friendly
- State Ohio
- 73 Landlord-Friendly · R+6
- County
- — inherits STATE
- City
- — inherits STATE
ZIP-level market 44621
- Home prices YoY
- -8.4%
- Active inventory
- 22
- Price-to-rent
- 6.7×
Monthly cashflow live
- Estimated rent
- $1,121 medium interval (Pro) →
- Mortgage (P&I)
- −$471
- Tax from tax record
- −$45 /mo · $546/yr
- Insurance
- −$37
- HOA
- −$0
- Vacancy / Maint / Mgmt
- −$235
- Net cashflow
- $331
Break-even live
Sensitivity live
| Price | -10% $382 | -5% $356 | +0% $331 | +5% $305 | +10% $280 |
|---|---|---|---|---|---|
| Rent | -10% $242 | -5% $287 | +0% $331 | +5% $375 | +10% $419 |
| Rate | -1.0pp $376 | -0.5pp $354 | base $331 | +0.5pp $308 | +1.0pp $284 |
UW: 25.0% down · 7.5% · 30yr · 1.5% tax · 5.0% vac · 8.0% maint · 8.0% mgmt
Financing live
Cash to close
- Down payment
- $22,475
- Closing costs
- $2,697
- Reserves months
- —
- Total cash needed
- —
Loan-product check · same deal, 3 products live
Conventional
25% down · 7.5% · 30yr
- Down + closing
- —
- Monthly P&I
- —
- Monthly cashflow
- —
- DSCR
- —
- Eligible?
- —
Personal DTI + credit; lowest rate.
DSCR
20% down · 8.5% · 30yr
- Down + closing
- —
- Monthly P&I
- —
- Monthly cashflow
- —
- DSCR
- —
- Eligible?
- —
No personal income docs; deal must DSCR.
Hard money
10% down · 12.0% · 12mo
- Down + closing
- —
- Monthly P&I
- —
- Monthly cashflow
- —
- DSCR
- —
- Eligible?
- —
Short-term bridge; refi at stabilization.
Listing history 29 events
-
2026-06-21days on market $89,900 Active 139 DOM
-
2026-06-21days on market $89,900 Active 138 DOM
-
2026-06-18days on market $89,900 Active 136 DOM
-
2026-06-17days on market $89,900 Active 135 DOM
-
2026-06-16days on market $89,900 Active 134 DOM
-
2026-06-15days on market $89,900 Active 133 DOM
-
2026-06-13days on market $89,900 Active 131 DOM
-
2026-06-12days on market $89,900 Active 130 DOM
-
2026-06-09days on market $89,900 Active 127 DOM
-
2026-06-08days on market $89,900 Active 126 DOM
-
2026-06-08days on market $89,900 Active 125 DOM
-
2026-06-07days on market $89,900 Active 124 DOM
-
2026-06-04days on market $89,900 Active 121 DOM
-
2026-06-02days on market $89,900 Active 120 DOM
-
2026-06-01days on market $89,900 Active 119 DOM
-
2026-05-31days on market $89,900 Active 118 DOM
-
2026-02-17price $89,900 420-char remark
Show marketing remark (420 chars)
Very well maintained cozy ranch. If you are looking to downsize or need an investment property. Main floor living with bedroom, living room, kitchen and bathroom. Kitchen leads to backdoor entryway with an area for coats and shoes. Basement has washer and dryer hook-up and lots of space for storage. Electric average $90/Gas average $50/Water average $60. HWT is rented. Appliances included are refrigerator and stove.
-
2026-02-02$94,900 Active 420-char remark
Show marketing remark (420 chars)
Very well maintained cozy ranch. If you are looking to downsize or need an investment property. Main floor living with bedroom, living room, kitchen and bathroom. Kitchen leads to backdoor entryway with an area for coats and shoes. Basement has washer and dryer hook-up and lots of space for storage. Electric average $90/Gas average $50/Water average $60. HWT is rented. Appliances included are refrigerator and stove.
-
2023-11-07soldstatus $72,500
-
2023-11-06soldstatus $72,500 Closed 205-char remark
Show marketing remark (205 chars)
Great starter home or investment property. 1-Bed and 1-Bath Ranch home will full basement. Fresh Paint and carpet. Quite area with patio out back. Easy Maintenace with vinyl siding and replacement windows.
-
2023-10-13status Pending 205-char remark
Show marketing remark (205 chars)
Great starter home or investment property. 1-Bed and 1-Bath Ranch home will full basement. Fresh Paint and carpet. Quite area with patio out back. Easy Maintenace with vinyl siding and replacement windows.
-
2023-09-22status Active 205-char remark
Show marketing remark (205 chars)
Great starter home or investment property. 1-Bed and 1-Bath Ranch home will full basement. Fresh Paint and carpet. Quite area with patio out back. Easy Maintenace with vinyl siding and replacement windows.
-
2023-08-16status Pending 205-char remark
Show marketing remark (205 chars)
Great starter home or investment property. 1-Bed and 1-Bath Ranch home will full basement. Fresh Paint and carpet. Quite area with patio out back. Easy Maintenace with vinyl siding and replacement windows.
-
2023-08-09$69,900 Active 205-char remark
Show marketing remark (205 chars)
Great starter home or investment property. 1-Bed and 1-Bath Ranch home will full basement. Fresh Paint and carpet. Quite area with patio out back. Easy Maintenace with vinyl siding and replacement windows.
-
2004-05-05soldstatus $7,500
-
2004-04-03$7,500
-
2003-11-03soldstatus $6,000
-
2003-10-31soldstatus $6,000
-
2003-04-25$7,500
ⓘ Source: listings_history table (triggers on properties + properties_extension) + one-shot
backfill from property_details.listing_events for pre-trigger history.
Tax reassessment forecast OH · Partial reset (capped growth)
- Current annual tax
- $546 · $45/mo
- Projected year-2 tax
- $974 · $81/mo
- Expected delta
- +$428/yr (+$36/mo · 78.4%)
ⓘ Screening estimate from a state-policy table — verify with the county assessor before closing.
Climate risk First Street
- Flood 1/10 Low FEMA zone X (unshaded) · 0% chance over 30 yrs
- Wildfire 1/10 Low
- Heat 4/10 Moderate 7 d/yr ≥99°F today · 18 d/yr by 30 yrs out
- Wind 1/10 Low
- Air quality 2/10 Low 1 unhealthy d/yr today · 2 by 30 yrs out
Nearby sold comps map
Loading sold comps map…
Walkable amenities ~0.75 mi
Loading nearby amenities…
Taxation est. · year 1
- Rental income
- $13,447
- − Mortgage interest
- −$5,036
- − Property taxes
- −$546
- − Insurance
- −$450
- − Repairs & maintenance
- −$1,076
- − Management
- −$1,076
- − Depreciation
- −$2,615
- Taxable income
- $2,649
- Est. tax owed @ 24.0%
- −$636
- After-tax cash flow
- $3,334/yr
For passive investors: Depreciation is non-cash, so a rental often shows a tax loss while cash-flowing — sheltering income. Rental losses are passive: they offset passive income freely, and up to $25,000/yr can offset ordinary (W-2) income if you actively participate and your MAGI is under $100k (phasing out to $0 by $150k); unused losses carry forward. On sale, claimed depreciation is recaptured at up to 25%, and gains may owe capital-gains tax (a 1031 exchange can defer both). Figures are a year-1 estimate at your 24.0% rate — not tax advice; consult a CPA.
Schools (NCES district)
- District
- Claymont City
- NCES district ID
- 3904377
- Math proficiency
- 47% ▼ -11.00%
- Reading proficiency
- 51% ▼ -15.00%
- Median HH income
- $37,563
- Composite
- 40.76/100
- National rank
- #3650
- State rank
- #467 of 656 in OH
Livability — Dennison
- Score
- 65/100
- State rank
- #726
- US rank
- #13190
Category grades
Schools grade is shown separately in the Schools card above.
Census & demographics
- Census place
- Dennison, OH
- County
- Tuscarawas · 99,287 people
- Population (ZIP)
- 4,639
- Household income
- $55,000
- Rent vs Own
- Severe rent burden
- 3.2
Population outlook (Tuscarawas County) Hauer SSP2
- Today (2025)
- 92,253 people
- By 2030
- 91,060 · -1.3%
- By 2040
- 87,479 · -5.2%
- By 2050
- 83,174 · -9.8%
- By 2075
- 72,000 · -22.0%
- By 2100
- 58,574 · -36.5%
Race, ethnicity, and origin ACS 2023
- Neighborhood character
- Predominantly White (95%)
- Race & ethnicity
- White 95% Two or more races 2% Black 2% Hispanic / Latino 1%
- Common ancestry
- Lithuanian 1% Slovak 1% Serbian 1%
- Languages at home
- 99% English-only · Spanish 1%
Political lean MEDSL · Tuscarawas
- 2024 margin
- Solid R (+43.3) · D 28.0% · R 71.2%
- 2008→2024 swing
- -45.7pp toward R · 2008: 2.4pp · 2024: -43.3pp
- All cycles
- 2024: R+43.3 2020: R+39.9 2016: R+35.5 2012: R+9.8 2008: D+2.4
Not yet ingested
- Civics
- —
Market trends
- HPI YoY
- ▼ -15.41%
- Current HPI
- 168.3657
- Rent YoY
- —
- Metro
- —
- State GDP YoY
- ▲ 1.98%
- F500 in state
- 48
Industry mix (Fortune 500 HQ in OH)
| Industry | F500 HQs | Revenue |
|---|---|---|
| Insurance | 3 | $145B |
|
||
| Industrial Machinery | 3 | $49B |
|
||
| Financial Services | 3 | $24B |
|
||
| Consumer Goods | 2 | $93B |
|
||
| Aerospace / Defense | 2 | $47B |
|
||
| Utilities | 2 | $33B |
|
||
Price history
+1098.7% since first listed13 events — show timeline
- 2026-02-17 Price Changed $89,900 MLSNOW
- 2026-02-02 Listed $94,900 MLSNOW
- 2023-11-07 Sold (Public Records) $72,500 Public Records
- 2023-11-06 Sold (MLS) $72,500 MLSNOW
- 2023-10-13 Pending — MLSNOW
- 2023-09-22 Relisted — MLSNOW
- 2023-08-16 Pending — MLSNOW
- 2023-08-09 Listed $69,900 MLSNOW
- 2004-05-05 Sold (MLS) $7,500 MLSNOW
- 2004-04-03 Listed $7,500 MLSNOW
- 2003-11-03 Sold (Public Records) $6,000 Public Records
- 2003-10-31 Sold (MLS) $6,000 MLSNOW
- 2003-04-25 Listed $7,500 MLSNOW
Property tax history
-0.9%/yrLatest (2025): $546 · +24.7% YoY. Source: county tax records.
Cash-flow waterfall
monthlySold comps — $/sqft
last 12 mo · ≤1 miLoading sold comps…