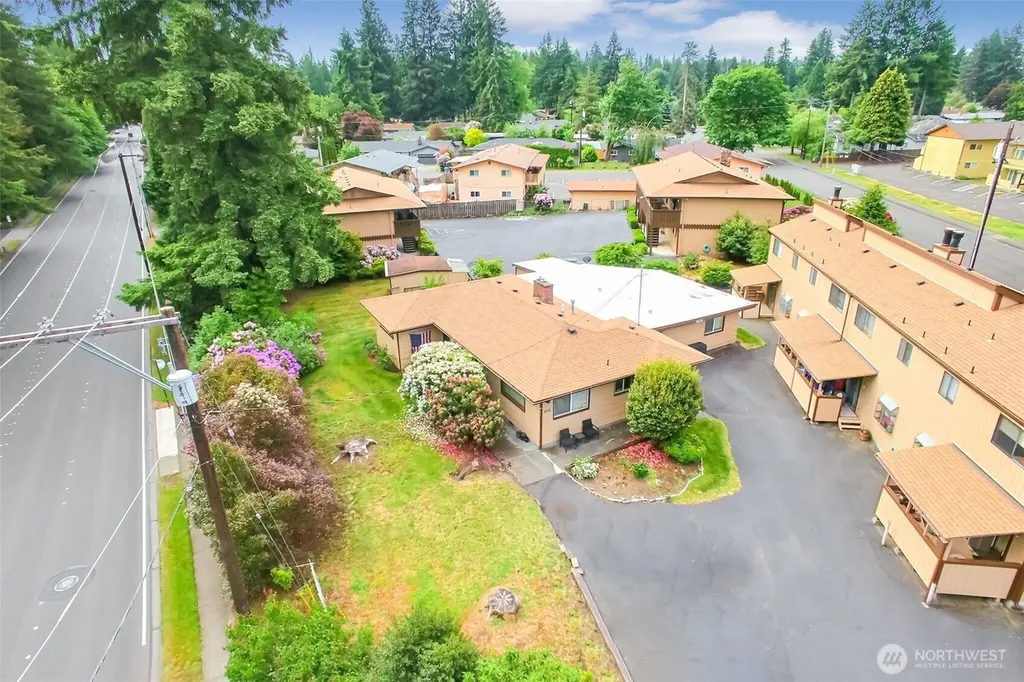
1608 Ruddell Rd SE
Lacey, WA 98053
$1,175,000C
3 bd · 2.0 ba ·
2,164 sqft ·
Built 1978
· MultiFamily
· Active
· 77 DOM
Cashflow @ list (25.0% down · 7.5%)
Estimated rent
$12,382/mo
Mortgage (P&I)
−$6,162
Tax + insurance
−$1,403
HOA
−$0
Vac / Maint / Mgmt
−$2,600
Net cashflow
$2,217/mo
Annual
$26,604/yr
Cap rate
8.56%
Cash-on-cash
8.09%
DSCR
1.36
1% rule
1.05%
Cash to close
$329,000
Investor read
- This is a 3-bed/2.0-bath multifamily listed at $1.18M.
- At list price, monthly cash flow is $2k ($27k/yr) — positive.
- The deal already cash-flows at list — no discount required.
- Meets the 1% rule at list price ($12k rent vs $1.18M).
- It's been on market 77 days — a 6% lower offer ($1.10M) is reasonable based on typical stale-listing flexibility.
- Recommended offer: $1.10M (6.0% below list) — sets the bar for market timing.
- Local home prices are declining (-3.0%/yr); year-one equity from $8k of loan paydown is wiped out by about $35k of value loss. Plan a longer hold.
- Location reads 85/100 on livability (#33 in WA, #581 nationally) — a professional / high-income tenant draw. Strengths: amenities A+, commute A+, housing A+; Watch: cost of living D+.
- North Thurston Public Schools (suburban): math 51% / reading 62% proficiency, ranked #80 of 291 in WA (top 28%) — acceptable for families but not a draw, mixed tenant base, ~2y average lease.
- Market conditions: Rents flat; 164 active listings in the ZIP; 6 comparable units currently listed for rent nearby; rentals lingering (median 45d on market — plan ~5-8 weeks vacancy on turnover, expect pricing pressure); 50% of comp listings sitting > 30 days — soft ceiling on asking rent; high-income renter base; 1,222 units permitted in Thurston County in 2024 (508 in 5+ unit buildings).
- Thurston County population projected at +27% by 2050 — long-run rental-demand tailwind backs the buy-and-hold thesis.
- 2 sale attempts; this cycle's ask has dropped $1.48M (56%) from the opening price — seller is motivated, your offer sets the floor, not the list.
- Current owner paid $910k; 29% above their basis — modest negotiation headroom, anchor on the comps not their cost.
- Cap rate 8.6% vs local median 3.0% in Lacey — top-decile yield for the area; either an underpriced asset or a hidden risk that comps aren't pricing in. Stress-test before assuming the spread holds.
- At $12,382/mo this rent would consume 77% of the median local household income ($192k/yr) (locally 375% of renters already pay >50% of income on rent) — very limited rent-growth headroom before tenants either downsize or default.
Questions for listing agent
- It's been on market 77 days. Have you received any prior offers? Is the seller open to a 6% concession, seller financing, or rate buy-down credit?
- Built in 1978 — when were the roof, HVAC, electrical panel, plumbing, and water heater last replaced?
- Why hasn't it sold? Are there any deal-killer items the seller is aware of (foundation, flood, title, zoning, code violations)?
- Is there a deadline driving the sale (1031 exchange, divorce, estate, relocation)? That informs how much negotiation room exists.
- Schools are B-rated — typically a magnet for longer-tenancy family renters. What's the average tenant stay here, and is there a school-zone premium baked into asking?
- What's the average days-on-market for RENTAL listings here right now (not sales)? A rising rental-DOM trend means longer vacancies and softer asking-rent achievability than the comps imply.
- What's the recent tenant-quality profile in this submarket — average credit score on applications, eviction rate, late-payment / NSF rate, and stable-employment percentage? A property-management company in the area should have these aggregated.
- How much new apartment / multifamily construction is in the pipeline within 1–3 miles? Heavy new supply (>2% of stock underway) typically softens rents 12–24 months out; light construction supports rent growth.
CashFlowRE · CFR-059C6DEEXM27H1
· Data 3 days ago
cashflowre.app · 2026-05-29