 Multi-family
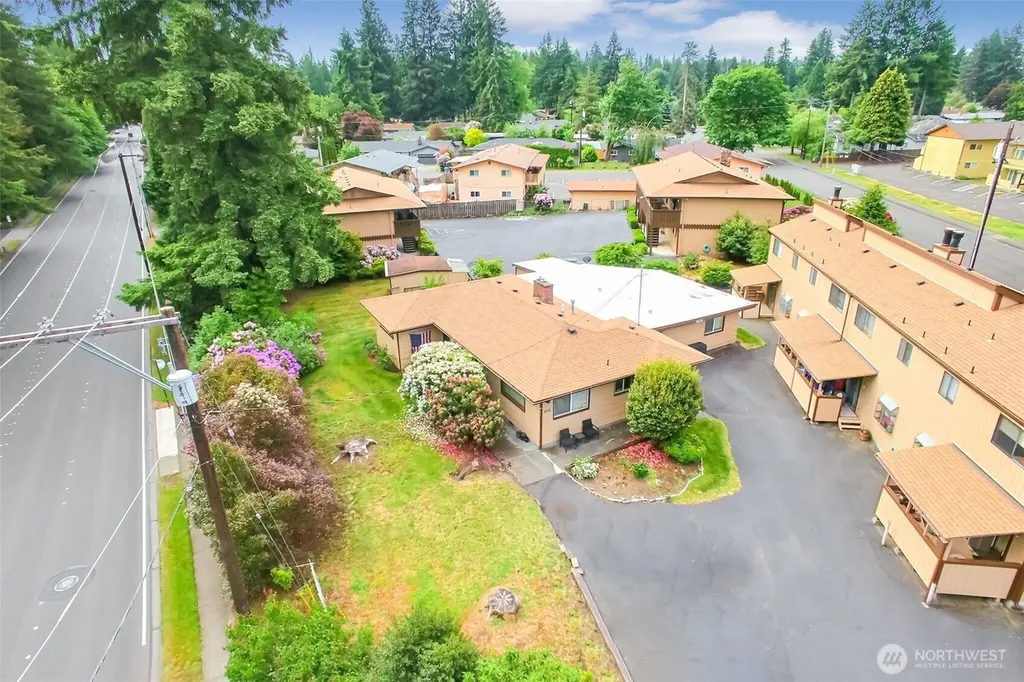
1608 Ruddell Rd SE · Lacey, WA
Flood risk 1/10 · Minimal
- FEMA flood zone
- X (unshaded)
- Chance of flooding over 30 yrs
- 0.0%
- Est. flood insurance / yr
- $507 – $1,088
Fire risk 1/10 · Minimal
- Est. fire insurance / yr
- $604 – $1,122
Heat risk 3/10 · Minor
- Hot days now (above 88°F)
- 7 days/yr
- Hot days in 30 yrs
- 14 days/yr
Wind risk 1/10 · Minimal
- Chance of severe wind over 30 yrs
- —
Air-quality risk 6/10 · Moderate
- Unhealthy air days now
- 7 days/yr
- Unhealthy air days in 30 yrs
- 8 days/yr
Risk factors via First Street. Map © Google.
Why this score? — see what drove the C grade
The composite is a weighted blend of 9 inputs, each scored 0–100. Each bar is that input's sub-score; the figure is the points it added to the 100-point composite (weight × sub-score).
- Cash flow +23.7/30.0
- DSCR +7.6/10.0
- ARV discount +7.5/15.0
- 1% rule +5.6/10.0
- Schools +5.1/10.0
- Livability +4.2/5.0
- Rent growth +2.6/5.0
- Condition / age +2.5/5.0
- Appreciation +0.0/10.0
$1,175,000
🖨 Deal sheet 📄 Offer letter ✓ Due diligence
Multi-family units
County records classify this as Multi-Family (5+ Unit). Listing-text estimate: 1 unit. estimate disagrees with records
5+ unit building — per-unit beds/baths from public records are typically unavailable; the breakdown below (if shown) is an estimate from the listing text.
Listing remarks
Rare add-value multifamily investment opportunity in Lacey! Features fully occupied a single-family home and a 4-plex with strong rental history. Conveniently located near I-5, JBLM, shopping, and schools. Great mix of unit types, stable income, and future upside. Ideal for both seasoned and new investors looking for scale and long-term growth in a strong rental market.
Key facts
- Strong rental market
- Stable income
- 0.98 acre lot
Tags
Neighborhood map
What this means for you Summary
Snapshot
- This is a 3-bed/2.0-bath multifamily listed at $1.18M.
Deal economics
- At list price, monthly cash flow is $2k ($27k/yr) — positive.
- The deal already cash-flows at list — no discount required.
- Meets the 1% rule at list price ($12k rent vs $1.18M).
- Recommended offer: $1.10M (6.0% below list) — sets the bar for market timing.
- Cap rate 8.6% vs local median 3.0% in Lacey — top-decile yield for the area; either an underpriced asset or a hidden risk that comps aren't pricing in. Stress-test before assuming the spread holds.
Location & tenants
- Location reads 85/100 on livability (#33 in WA, #581 nationally) — a professional / high-income tenant draw. Strengths: amenities A+, commute A+, housing A+; Watch: cost of living D+.
- North Thurston Public Schools (suburban): math 51% / reading 62% proficiency, ranked #80 of 291 in WA (top 28%) — acceptable for families but not a draw, mixed tenant base, ~2y average lease.
- Market conditions: Rents flat; 164 active listings in the ZIP; 6 comparable units currently listed for rent nearby; rentals lingering (median 44d on market — plan ~5-8 weeks vacancy on turnover, expect pricing pressure); 50% of comp listings sitting > 30 days — soft ceiling on asking rent; high-income renter base; 1,222 units permitted in Thurston County in 2024 (508 in 5+ unit buildings).
- At $12,417/mo this rent would consume 77% of the median local household income ($192k/yr) (locally 375% of renters already pay >50% of income on rent) — very limited rent-growth headroom before tenants either downsize or default.
Forward outlook
- Local home prices are declining (-3.0%/yr); year-one equity from $8k of loan paydown is wiped out by about $35k of value loss. Plan a longer hold.
- Thurston County population projected at +27% by 2050 — long-run rental-demand tailwind backs the buy-and-hold thesis.
Negotiation context
- It's been on market 77 days — a 6% lower offer ($1.10M) is reasonable based on typical stale-listing flexibility.
- 2 sale attempts; this cycle's ask has dropped $1.48M (56%) from the opening price — seller is motivated, your offer sets the floor, not the list.
- Current owner paid $910k; 29% above their basis — modest negotiation headroom, anchor on the comps not their cost.
Questions for the listing agent
- It's been on market 77 days. Have you received any prior offers? Is the seller open to a 6% concession, seller financing, or rate buy-down credit?
- Built in 1978 — when were the roof, HVAC, electrical panel, plumbing, and water heater last replaced?
- Why hasn't it sold? Are there any deal-killer items the seller is aware of (foundation, flood, title, zoning, code violations)?
- Is there a deadline driving the sale (1031 exchange, divorce, estate, relocation)? That informs how much negotiation room exists.
- Schools are B-rated — typically a magnet for longer-tenancy family renters. What's the average tenant stay here, and is there a school-zone premium baked into asking?
- What's the average days-on-market for RENTAL listings here right now (not sales)? A rising rental-DOM trend means longer vacancies and softer asking-rent achievability than the comps imply.
- What's the recent tenant-quality profile in this submarket — average credit score on applications, eviction rate, late-payment / NSF rate, and stable-employment percentage? A property-management company in the area should have these aggregated.
- How much new apartment / multifamily construction is in the pipeline within 1–3 miles? Heavy new supply (>2% of stock underway) typically softens rents 12–24 months out; light construction supports rent growth.
Investment metrics
- 1% rule
- 1.06% ✓
- Cap rate
- 8.59%
- Cash-on-cash
- 8.19%
- DSCR
- 1.36
- GRM
- 7.9
CMA / ARV
- ARV (on-the-fly)
- $512,868
- Comps found
- 1
Show comp detail 1 sale within ~0.75 mi
| Address | Dist | Beds/Ba | Sqft | Sold | Price | $/sf | Match |
|---|---|---|---|---|---|---|---|
| 1502 Yonkers Dr SE Unit A&B | 0.57mi | 4/3.0 (+1) | 2,486 (+15%) | 6mo | $590,000 | $237 | 35 |
Match score weights: distance 35% · size 25% · config 20% · recency 20%. Top-matched comps best support the ARV.
Projected returns pro-forma
-3.0% appreciation · 0.36% rent growth · sell at horizon
- IRR
- -6.7%
- Equity multiple
- 0.76×
- Total profit
- $-79,728
- Equity at exit
- $175,196
- IRR
- -0.5%
- Equity multiple
- 0.97×
- Total profit
- $-11,045
- Equity at exit
- $101,593
Cash invested: $329,000 (down + closing). Projections, not guarantees.
Landlord ↔ Tenant lean methodology
- Overall (STATE)
- 28 Tenant-Leaning
- State Washington
- 28 Tenant-Leaning · D+8
- County
- — inherits STATE
- City
- — inherits STATE
ZIP-level market 98053
- Rents YoY
- 0.4%
- Active inventory
- 164
- Price-to-rent
- 47.3×
Monthly cashflow live
- Estimated rent
- $12,417 medium interval (Pro) →
- Mortgage (P&I)
- −$6,162
- Tax from tax record
- −$913 /mo · $10,961/yr
- Insurance
- −$490
- HOA
- −$0
- Vacancy / Maint / Mgmt
- −$2,608
- Net cashflow
- $2,245
Break-even live
6-unit breakdown (identical units grouped — click to expand)
| Units | Beds | Baths | Est. rent |
|---|---|---|---|
| 6× units | 2 | 1 | $12,414 |
| #1 | 2 | 1 | $2,069 |
| #2 | 2 | 1 | $2,069 |
| #3 | 2 | 1 | $2,069 |
| #4 | 2 | 1 | $2,069 |
| #5 | 2 | 1 | $2,069 |
| #6 | 2 | 1 | $2,069 |
| Total (6 units) | $12,417 | ||
UW: 25.0% down · 7.5% · 30yr · 1.5% tax · 5.0% vac · 8.0% maint · 8.0% mgmt
Financing live
Cash to close
- Down payment
- $293,750
- Closing costs
- $35,250
- Reserves months
- —
- Total cash needed
- —
Loan-product check · same deal, 3 products live
Conventional
25% down · 7.5% · 30yr
- Down + closing
- —
- Monthly P&I
- —
- Monthly cashflow
- —
- DSCR
- —
- Eligible?
- —
Personal DTI + credit; lowest rate.
DSCR
20% down · 8.5% · 30yr
- Down + closing
- —
- Monthly P&I
- —
- Monthly cashflow
- —
- DSCR
- —
- Eligible?
- —
No personal income docs; deal must DSCR.
Hard money
10% down · 12.0% · 12mo
- Down + closing
- —
- Monthly P&I
- —
- Monthly cashflow
- —
- DSCR
- —
- Eligible?
- —
Short-term bridge; refi at stabilization.
Rent comps 6 comps
| Address | Beds | Baths | Sqft | Rent | $/sqft | DOM | Units | Dist |
|---|---|---|---|---|---|---|---|---|
| 4821 27th Ln SE Lacey, WA | 3.0 | 2.0 | 1718 | $2,625 | $1.53 | 43d | 1 | 0.55mi |
| 2134 Diamond Loop SE Lacey, WA | 4.0 | 3.0 | 2582 | $2,795 | $1.08 | 43d | 1 | 0.97mi |
| 6103 Carmel Ln SE Lacey, WA | 3.0 | 2.5 | 1500 | $2,350 | $1.57 | 21d | 1 | 1.18mi |
| 1330 Fones Rd SE Olympia, WA | 2.0 | 2.5 | 1406 | $2,250 | $1.60 | 21d | 4 | 1.34mi |
| 3725 Wildspitz Ln SE Lacey, WA | 3.0–4.0 | 3.0 | 1774 | $2,695 | $1.52 | 43d | 4 | 1.36mi |
| 4820 41st Ln SE Lacey, WA | 3.0 | 2.5 | 1716 | $2,395 | $1.40 | 13d | 1 | 1.50mi |
Listing history 19 events
-
2026-06-18days on market $1,175,000 Active 77 DOM
-
2026-06-17days on market $1,175,000 Active 76 DOM
-
2026-06-16days on market $1,175,000 Active 75 DOM
-
2026-06-15days on market $1,175,000 Active 74 DOM
-
2026-06-14days on market $1,175,000 Active 72 DOM
-
2026-06-13days on market $1,175,000 Active 71 DOM
-
2026-06-10days on market $1,175,000 Active 69 DOM
-
2026-06-09days on market $1,175,000 Active 68 DOM
-
2026-06-08days on market $1,175,000 Active 67 DOM
-
2026-06-07days on market $1,175,000 Active 66 DOM
-
2026-06-03days on market $1,175,000 Active 62 DOM
-
2026-06-02days on market $1,175,000 Active 61 DOM
-
2026-06-01days on market $1,175,000 Active 60 DOM
-
2026-05-31days on market $1,175,000 Active 59 DOM
-
2026-05-30days on market $1,175,000 Active 58 DOM
-
2026-04-02$1,175,000 Active
-
2026-04-02$2,650,000 Active
-
2015-06-30soldstatus $910,000
-
1984-03-30soldstatus $170,800
ⓘ Source: listings_history table (triggers on properties + properties_extension) + one-shot
backfill from property_details.listing_events for pre-trigger history.
Tax reassessment forecast WA · Resets to sale price
- Current annual tax
- $10,961 · $913/mo
- Projected year-2 tax
- $11,515 · $960/mo
- Expected delta
- +$554/yr (+$46/mo · 5.1%)
ⓘ Screening estimate from a state-policy table — verify with the county assessor before closing.
Climate risk First Street
- Flood 1/10 Low FEMA zone X (unshaded) · 0% chance over 30 yrs
- Wildfire 1/10 Low
- Heat 3/10 Moderate 7 d/yr ≥88°F today · 14 d/yr by 30 yrs out
- Wind 1/10 Low
- Air quality 6/10 Major 7 unhealthy d/yr today · 8 by 30 yrs out
Nearby sold comps map
Loading sold comps map…
Walkable amenities ~0.75 mi
Loading nearby amenities…
Taxation est. · year 1
- Rental income
- $149,004
- − Mortgage interest
- −$65,818
- − Property taxes
- −$10,961
- − Insurance
- −$5,875
- − Repairs & maintenance
- −$11,920
- − Management
- −$11,920
- − Depreciation
- −$34,182
- Taxable income
- $8,328
- Est. tax owed @ 24.0%
- −$1,999
- After-tax cash flow
- $24,937/yr
For passive investors: Depreciation is non-cash, so a rental often shows a tax loss while cash-flowing — sheltering income. Rental losses are passive: they offset passive income freely, and up to $25,000/yr can offset ordinary (W-2) income if you actively participate and your MAGI is under $100k (phasing out to $0 by $150k); unused losses carry forward. On sale, claimed depreciation is recaptured at up to 25%, and gains may owe capital-gains tax (a 1031 exchange can defer both). Figures are a year-1 estimate at your 24.0% rate — not tax advice; consult a CPA.
Schools (NCES district)
- District
- North Thurston Public Schools
- NCES district ID
- 5305850
- Math proficiency
- 51% ▬ 0.00%
- Reading proficiency
- 62% ▬ 0.00%
- Median HH income
- $62,338
- Composite
- 51.09/100
- National rank
- #3798
- State rank
- #80 of 291 in WA
Livability — Lacey
- Score
- 85/100
- State rank
- #33
- US rank
- #581
Category grades
Schools grade is shown separately in the Schools card above.
Census & demographics
- Census place
- Lacey, WA
- County
- King County · 2,251,916 people
- City population
- 108,850
- Metro
- Seattle-Tacoma-Bellevue, WA
- Population (ZIP)
- 22,765
- Household income
- $192,292
- Rent vs Own
- Severe rent burden
- 375.0
Population outlook (Thurston County) Hauer SSP2
- Today (2025)
- 308,239 people
- By 2030
- 326,483 · +5.9%
- By 2040
- 359,890 · +16.8%
- By 2050
- 391,800 · +27.1%
- By 2075
- 468,024 · +51.8%
- By 2100
- 519,890 · +68.7%
Race, ethnicity, and origin ACS 2023
- Neighborhood character
- Diverse neighborhood (Simpson 0.58)
- Race & ethnicity
- White 59% Asian 28% Two or more races 9% Hispanic / Latino 6% Black 1%
- Hispanic origin (detail)
- Mexican 2%
- Common ancestry
- Portuguese 4% Italian 4% Slovak 3%
- Foreign-born
- 30% · Canada, China, South Korea
- Languages at home
- 68% English-only · Other Indo-European 13% Other Asian/Pacific 7% Chinese 3%
Political lean MEDSL · Thurston
- 2024 margin
- Strong D (+20.4) · D 58.5% · R 38.1% · Other 3.5%
- 2008→2024 swing
- -1.3pp toward R · 2008: 21.7pp · 2024: 20.4pp
- All cycles
- 2024: D+20.4 2020: D+18.6 2016: D+15.4 2012: D+19.0 2008: D+21.7
Not yet ingested
- Civics
- —
Market trends
- HPI YoY
- ▼ -466.89%
- Current HPI
- 362.4257
- Rent YoY
- ▲ 0.36%
- Metro
- Seattle-Tacoma-Bellevue, WA
- State GDP YoY
- ▲ 4.65%
- F500 in state
- 22
Industry mix (Fortune 500 HQ in WA)
| Industry | F500 HQs | Revenue |
|---|---|---|
| Retail | 2 | $269B |
|
||
| Technology / Retail | 1 | $638B |
|
||
| Technology | 1 | $245B |
|
||
| Telecommunications | 1 | $38B |
|
||
| Food / Beverage | 1 | $36B |
|
||
| Automotive / Trucks | 1 | $34B |
|
||
Price history
+1451.5% since first listed4 events — show timeline
- 2026-04-02 Listed $2,650,000 NWMLS as Distributed by MLS Grid
- 2026-04-02 Listed $1,175,000 NWMLS as Distributed by MLS Grid
- 2015-06-30 Sold (Public Records) $910,000 Public Records
- 1984-03-30 Sold (Public Records) $170,800 Public Records
Property tax history
+5.5%/yrLatest (2026): $10,961 · -7.6% YoY. Source: county tax records.
Cash-flow waterfall
monthlySold comps — $/sqft
last 12 mo · ≤1 miLoading sold comps…