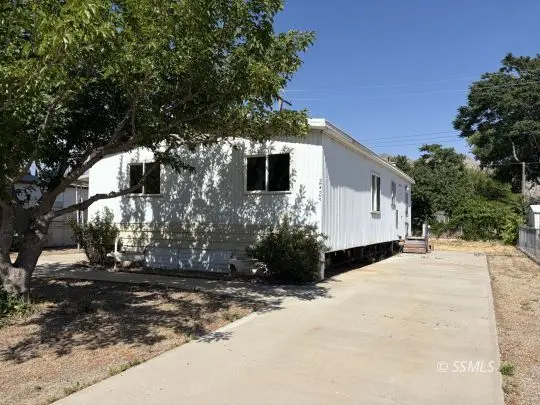
2423 Harnage St
Lake Isabella, CA 93240
$59,000A-
3 bd · 2.0 ba ·
800 sqft ·
Built 1976
· Manufactured
· Active
· 22 DOM
Cashflow @ list (25.0% down · 7.5%)
Estimated rent
$1,584/mo
Mortgage (P&I)
−$309
Tax + insurance
−$98
HOA
−$0
Vac / Maint / Mgmt
−$333
Net cashflow
$844/mo
Annual
$10,126/yr
Cap rate
23.46%
Cash-on-cash
61.30%
DSCR
3.73
1% rule
2.69%
Cash to close
$16,520
Investor read
- This is a 3-bed/2.0-bath manufactured listed at $59k. Condition is rated fair.
- At list price, monthly cash flow is $844 ($10k/yr) — positive.
- The deal already cash-flows at list — no discount required.
- Meets the 1% rule at list price ($2k rent vs $59k).
- It's been on market 22 days — a 2% lower offer ($58k) is reasonable based on typical stale-listing flexibility.
- Recommended offer: $58k (1.5% below list) — sets the bar for market timing.
- In year one you build about $4k of equity ($408 loan paydown + $3k appreciation (5.5% local appreciation)).
- Location reads 52/100 on livability (#999 in CA) — a working-class tenant base; expect higher turnover. Strengths: housing A, cost of living B+; Watch: crime C-, schools F, amenities F.
- Kernville Union Elementary (rural): math 20% / reading 37% proficiency, ranked #1,128 of 1,400 in CA (top 81%) — low school quality limits family demand, transient renter base, plan for 1-2y turnover; 65% free/reduced lunch — lower-income household profile, screen leases tightly.
- Market conditions: 135 active listings in the ZIP; 3,244 units permitted in Kern County in 2024 (73 in 5+ unit buildings).
- Kern County population projected at +17% by 2050 — long-run rental-demand tailwind backs the buy-and-hold thesis.
- At projected returns (5.5% appreciation + 3.0% rent growth), your $17k cash investment doubles in ~2 years — after that, you're playing with house money.
- By year 9, paydown + projected appreciation supports a ~$33k cash-out refi (75% LTV) — recoverable capital for the next deal without selling this one.
- Climate carrying-cost: severe wildfire risk; extreme-heat days projected 10→27/yr by 2055 (HVAC capex compounding) — expect insurance premiums to compound above CPI over the hold.
- Cap rate 23.5% vs local median 7.4% in Lake Isabella — top-decile yield for the area; either an underpriced asset or a hidden risk that comps aren't pricing in. Stress-test before assuming the spread holds.
Questions for listing agent
- Have any recent inspections been done? Can we get a copy of the seller's disclosures and any deferred-maintenance estimates?
- Built in 1976 — when were the roof, HVAC, electrical panel, plumbing, and water heater last replaced?
- Is there a deadline driving the sale (1031 exchange, divorce, estate, relocation)? That informs how much negotiation room exists.
- Schools are F-rated, which usually means shorter tenancies and higher turnover. Who's the typical renter profile here, and what's been the actual vacancy rate?
- What's the average days-on-market for RENTAL listings here right now (not sales)? A rising rental-DOM trend means longer vacancies and softer asking-rent achievability than the comps imply.
- What's the recent tenant-quality profile in this submarket — average credit score on applications, eviction rate, late-payment / NSF rate, and stable-employment percentage? A property-management company in the area should have these aggregated.
- How much new for-sale + rental construction is in the pipeline within 1–3 miles? Heavy new supply typically softens prices + rents 12–24 months out; constrained supply supports both.
Repairs flagged (vision-AI assessment)
- Major: roof — Significant wear and potential leaks.
- Major: exterior siding — Peeling paint and general discoloration.
- Major: flooring — Visible wear and tear.
- Major: interior walls/paint — Visible wear and tear.
- Major: windows — Visible wear and tear.
- Major: foundation/structure — Visible wear and tear.
CashFlowRE · CFR-05DF6PAM3EFDV0
· Data 2 days ago
cashflowre.app · 2026-05-29