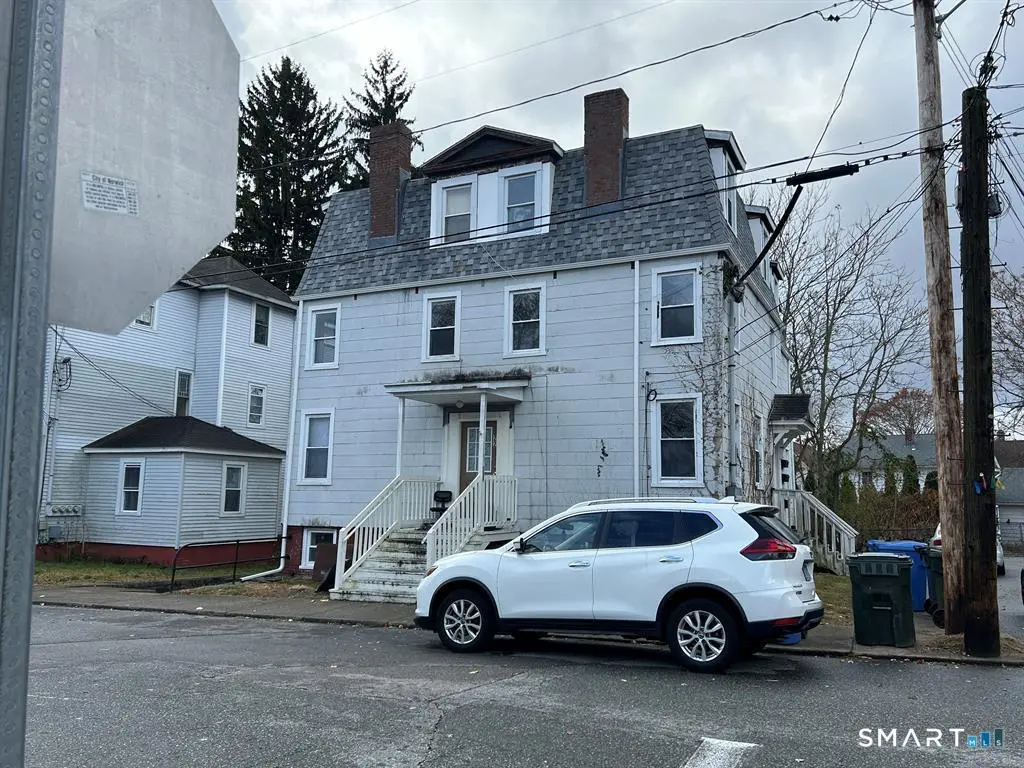
22 Hawthorne St
Norwich, CT 06360
$870,000C+
66 bd · 36.0 ba ·
4,949 sqft ·
Built 1870
· MultiFamily
· Active
· 119 DOM
Cashflow @ list (25.0% down · 7.5%)
Estimated rent
$9,576/mo
Mortgage (P&I)
−$4,562
Tax + insurance
−$868
HOA
−$0
Vac / Maint / Mgmt
−$2,011
Net cashflow
$2,135/mo
Annual
$25,617/yr
Cap rate
9.24%
Cash-on-cash
10.52%
DSCR
1.47
1% rule
1.10%
Cash to close
$243,600
Investor read
- This is a 4×1bd/1ba + 1×4bd/1ba + 1×3bd/1ba units multifamily listed at $870k.
- At list price, monthly cash flow is $2k ($26k/yr) — positive. Per door: $356/mo.
- The deal already cash-flows at list — no discount required.
- Meets the 1% rule at list price ($10k rent vs $870k).
- It's been on market 119 days — a 9% lower offer ($792k) is reasonable based on typical stale-listing flexibility.
- Recommended offer: $792k (9.0% below list) — sets the bar for market timing.
- Local home prices are declining (-3.0%/yr); year-one equity from $6k of loan paydown is wiped out by about $26k of value loss. Plan a longer hold.
- Location reads 81/100 on livability (#18 in CT, #1,391 nationally) — a professional / high-income tenant draw. Strengths: housing A+, health & safety A+, commute A-; Watch: schools D+.
- Norwich School District (urban): math 19% / reading 29% proficiency, ranked #139 of 153 in CT (top 91%) — low school quality limits family demand, transient renter base, plan for 1-2y turnover; 62% free/reduced lunch — lower-income household profile, screen leases tightly.
- Watch-outs: built in 1870 — expect roof / HVAC / electrical / plumbing capex.
- Market conditions: Rents rising fast (+6.6%/yr); 241 active listings in the ZIP; 487 units permitted in Southeastern Connecticut Planning Region in 2024 (244 in 5+ unit buildings).
- 4 sale attempts; this cycle's ask is 51840% above the opening price — seller raised mid-cycle; expect resistance to lowballs.
- At projected returns (-3.0% appreciation + 6.6% rent growth), your $244k cash investment doubles in ~8 years — after that, you're playing with house money.
- Climate carrying-cost: major wind risk, 67% chance of damaging wind over 30y; extreme-heat days projected 7→17/yr by 2055 (HVAC capex compounding) — expect insurance premiums to compound above CPI over the hold.
- Cap rate 9.2% vs local median 4.0% in Norwich — top-decile yield for the area; either an underpriced asset or a hidden risk that comps aren't pricing in. Stress-test before assuming the spread holds.
- At $9,576/mo this rent would consume 175% of the median local household income ($66k/yr) (locally 1643% of renters already pay >50% of income on rent) — very limited rent-growth headroom before tenants either downsize or default.
Questions for listing agent
- It's been on market 119 days. Have you received any prior offers? Is the seller open to a 9% concession, seller financing, or rate buy-down credit?
- Can we see the unit-by-unit rent roll, current vacancy, and any below-market leases? What's the average tenancy length?
- What capital expenditures (roof, boiler, parking lot, exteriors) have been made in the last 5 years, and what's planned in the next 2?
- Built in 1870 — when were the roof, HVAC, electrical panel, plumbing, and water heater last replaced?
- Why hasn't it sold? Are there any deal-killer items the seller is aware of (foundation, flood, title, zoning, code violations)?
- Is there a deadline driving the sale (1031 exchange, divorce, estate, relocation)? That informs how much negotiation room exists.
- Schools are D-rated, which usually means shorter tenancies and higher turnover. Who's the typical renter profile here, and what's been the actual vacancy rate?
- What's the average days-on-market for RENTAL listings here right now (not sales)? A rising rental-DOM trend means longer vacancies and softer asking-rent achievability than the comps imply.
CashFlowRE · CFR-0666FJFD0HR8S4
· Data 3 weeks ago
cashflowre.app · 2026-05-29