 6-Plex
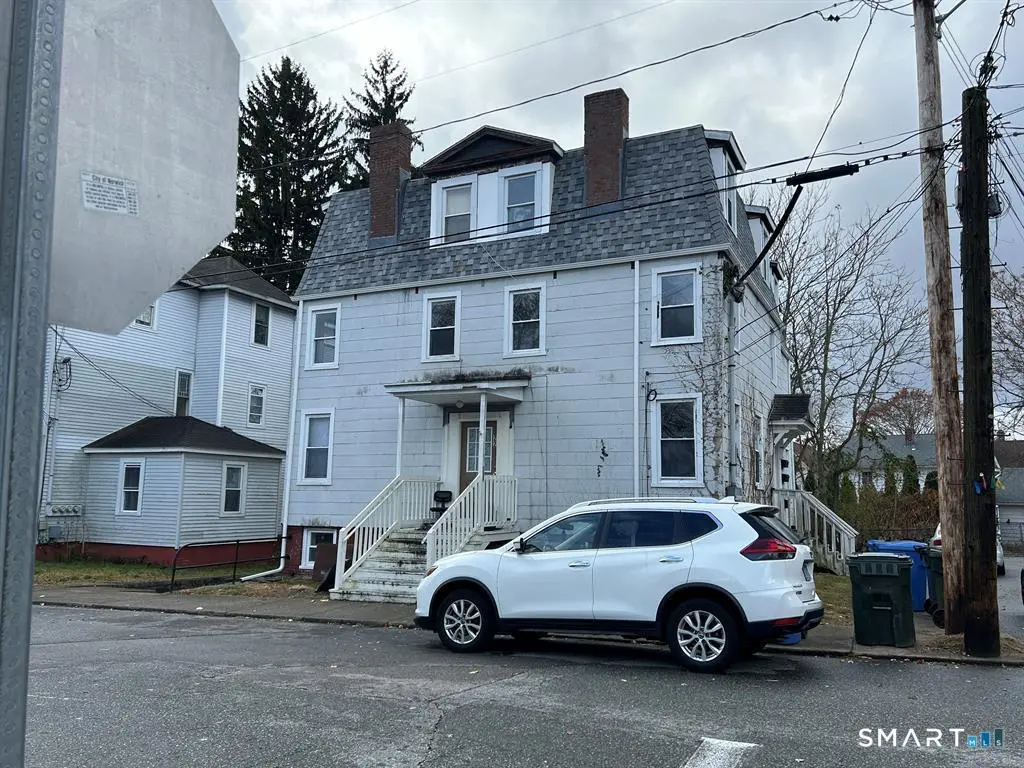
22 Hawthorne St · Norwich, CT
Flood risk 1/10 · Minimal
- FEMA flood zone
- X (unshaded)
- Chance of flooding over 30 yrs
- 0.0%
- Est. flood insurance / yr
- $473 – $860
Fire risk 3/10 · Minor
- Est. fire insurance / yr
- $829 – $1,539
Heat risk 6/10 · Moderate
- Hot days now (above 97°F)
- 7 days/yr
- Hot days in 30 yrs
- 17 days/yr
Wind risk 6/10 · Moderate
- Chance of severe wind over 30 yrs
- 67.0%
Air-quality risk 3/10 · Minor
- Unhealthy air days now
- 2 days/yr
- Unhealthy air days in 30 yrs
- 3 days/yr
Risk factors via First Street. Map © Google.
Why this score? — see what drove the C+ grade
The composite is a weighted blend of 9 inputs, each scored 0–100. Each bar is that input's sub-score; the figure is the points it added to the 100-point composite (weight × sub-score).
- Cash flow +25.9/30.0
- DSCR +8.7/10.0
- ARV discount +7.5/15.0
- 1% rule +6.0/10.0
- Rent growth +4.2/5.0
- Livability +4.0/5.0
- Condition / age +2.5/5.0
- Schools +2.1/10.0
- Appreciation +0.0/10.0
$870,000
🖨 Deal sheet 📄 Offer letter ✓ Due diligence
Multi-family units
County records classify this as Multi-Family (5+ Unit). Listing-text estimate: 6 units. confirmed
5+ unit building — per-unit beds/baths from public records are typically unavailable; the breakdown below (if shown) is an estimate from the listing text.
Listing remarks MLS
INVESTORS TAKE NOTICE. 6 family income producing property for sale. 4 one bedrooms and 1 four bedroom unit and 1 three bedroom unit. Units recently updated with fresh paint and new flooring. Bright apartments with an abundance of natural light.
Key facts
- Recently updated
- Natural light
- 3,920 sq ft lot
Tags
Neighborhood map
What this means for you Summary
Snapshot
- This is a 4×1bd/1ba + 1×4bd/1ba + 1×3bd/1ba units multifamily listed at $870k.
Deal economics
- At list price, monthly cash flow is $2k ($26k/yr) — positive. Per door: $356/mo.
- The deal already cash-flows at list — no discount required.
- Meets the 1% rule at list price ($10k rent vs $870k).
- Recommended offer: $792k (9.0% below list) — sets the bar for market timing.
- Cap rate 9.2% vs local median 4.0% in Norwich — top-decile yield for the area; either an underpriced asset or a hidden risk that comps aren't pricing in. Stress-test before assuming the spread holds.
Location & tenants
- Location reads 81/100 on livability (#18 in CT, #1,391 nationally) — a professional / high-income tenant draw. Strengths: housing A+, health & safety A+, commute A-; Watch: schools D+.
- Norwich School District (urban): math 19% / reading 29% proficiency, ranked #139 of 153 in CT (top 91%) — low school quality limits family demand, transient renter base, plan for 1-2y turnover; 62% free/reduced lunch — lower-income household profile, screen leases tightly.
- Market conditions: Rents rising fast (+6.6%/yr); 241 active listings in the ZIP; 487 units permitted in Southeastern Connecticut Planning Region in 2024 (244 in 5+ unit buildings).
- At $9,576/mo this rent would consume 175% of the median local household income ($66k/yr) (locally 1643% of renters already pay >50% of income on rent) — very limited rent-growth headroom before tenants either downsize or default.
Forward outlook
- Local home prices are declining (-3.0%/yr); year-one equity from $6k of loan paydown is wiped out by about $26k of value loss. Plan a longer hold.
- At projected returns (-3.0% appreciation + 6.6% rent growth), your $244k cash investment doubles in ~8 years — after that, you're playing with house money.
Negotiation context
- It's been on market 119 days — a 9% lower offer ($792k) is reasonable based on typical stale-listing flexibility.
- 4 sale attempts; this cycle's ask is 51840% above the opening price — seller raised mid-cycle; expect resistance to lowballs.
Risks & watch-outs
- Watch-outs: built in 1870 — expect roof / HVAC / electrical / plumbing capex.
- Climate carrying-cost: major wind risk, 67% chance of damaging wind over 30y; extreme-heat days projected 7→17/yr by 2055 (HVAC capex compounding) — expect insurance premiums to compound above CPI over the hold.
Questions for the listing agent
- It's been on market 119 days. Have you received any prior offers? Is the seller open to a 9% concession, seller financing, or rate buy-down credit?
- Can we see the unit-by-unit rent roll, current vacancy, and any below-market leases? What's the average tenancy length?
- What capital expenditures (roof, boiler, parking lot, exteriors) have been made in the last 5 years, and what's planned in the next 2?
- Built in 1870 — when were the roof, HVAC, electrical panel, plumbing, and water heater last replaced?
- Why hasn't it sold? Are there any deal-killer items the seller is aware of (foundation, flood, title, zoning, code violations)?
- Is there a deadline driving the sale (1031 exchange, divorce, estate, relocation)? That informs how much negotiation room exists.
- Schools are D-rated, which usually means shorter tenancies and higher turnover. Who's the typical renter profile here, and what's been the actual vacancy rate?
- What's the average days-on-market for RENTAL listings here right now (not sales)? A rising rental-DOM trend means longer vacancies and softer asking-rent achievability than the comps imply.
- What's the recent tenant-quality profile in this submarket — average credit score on applications, eviction rate, late-payment / NSF rate, and stable-employment percentage? A property-management company in the area should have these aggregated.
- How much new apartment / multifamily construction is in the pipeline within 1–3 miles? Heavy new supply (>2% of stock underway) typically softens rents 12–24 months out; light construction supports rent growth.
Investment metrics
- 1% rule
- 1.10% ✓
- Cap rate
- 9.24%
- Cash-on-cash
- 10.52%
- DSCR
- 1.47
- GRM
- 7.6
CMA / ARV
- ARV (median comp)
- $426,508
- List price
- $870,000
- Delta
- 103.98%
- Verdict
- OVERPRICED
- Comps
- 20 within 1.0 mi
Projected returns pro-forma
-3.0% appreciation · 6.62% rent growth · sell at horizon
- IRR
- 3.2%
- Equity multiple
- 1.13×
- Total profit
- $30,918
- Equity at exit
- $129,720
- IRR
- 15.7%
- Equity multiple
- 2.48×
- Total profit
- $360,936
- Equity at exit
- $75,222
Cash invested: $243,600 (down + closing). Projections, not guarantees.
Landlord ↔ Tenant lean methodology
- Overall (STATE)
- 27 Tenant-Leaning
- State Connecticut
- 27 Tenant-Leaning · D+7
- County
- — inherits STATE
- City
- — inherits STATE
ZIP-level market 06360
- Home prices YoY
- -19.9%
- Rents YoY
- 6.6%
- Active inventory
- 241
- Price-to-rent
- 50.2×
Monthly cashflow live
- Estimated rent
- $9,576 high interval (Pro) →
- Mortgage (P&I)
- −$4,562
- Tax from tax record
- −$505 /mo · $6,065/yr
- Insurance
- −$362
- HOA
- −$0
- Vacancy / Maint / Mgmt
- −$2,011
- Net cashflow
- $2,135
Break-even live
6-unit breakdown (identical units grouped — click to expand)
| Units | Beds | Baths | Est. rent |
|---|---|---|---|
| 4× units | 1 | 1 | $5,784 |
| #1 | 1 | 1 | $1,446 |
| #2 | 1 | 1 | $1,446 |
| #3 | 1 | 1 | $1,446 |
| #4 | 1 | 1 | $1,446 |
| 1× unit | 4 | 1 | $2,000 |
| 1× unit | 3 | 1 | $1,794 |
| Total (6 units) | $9,576 | ||
UW: 25.0% down · 7.5% · 30yr · 1.5% tax · 5.0% vac · 8.0% maint · 8.0% mgmt
Financing live
Cash to close
- Down payment
- $217,500
- Closing costs
- $26,100
- Reserves months
- —
- Total cash needed
- —
Loan-product check · same deal, 3 products live
Conventional
25% down · 7.5% · 30yr
- Down + closing
- —
- Monthly P&I
- —
- Monthly cashflow
- —
- DSCR
- —
- Eligible?
- —
Personal DTI + credit; lowest rate.
DSCR
20% down · 8.5% · 30yr
- Down + closing
- —
- Monthly P&I
- —
- Monthly cashflow
- —
- DSCR
- —
- Eligible?
- —
No personal income docs; deal must DSCR.
Hard money
10% down · 12.0% · 12mo
- Down + closing
- —
- Monthly P&I
- —
- Monthly cashflow
- —
- DSCR
- —
- Eligible?
- —
Short-term bridge; refi at stabilization.
Listing history 7 events
-
2026-05-17historical $1,675
-
2026-05-09$1,675
-
2026-04-26historical $1,100
-
2026-04-25historical $1,100
-
2026-03-25$1,100
-
2026-03-25$1,750
-
2026-01-28$900,000 Active 244-char remark
Show marketing remark (244 chars)
INVESTORS TAKE NOTICE. 6 family income producing property for sale. 4 one bedrooms and 1 four bedroom unit and 1 three bedroom unit. Units recently updated with fresh paint and new flooring. Bright apartments with an abundance of natural light.
ⓘ Source: listings_history table (triggers on properties + properties_extension) + one-shot
backfill from property_details.listing_events for pre-trigger history.
Tax reassessment forecast CT · Partial reset (capped growth)
- Current annual tax
- $6,065 · $505/mo
- Projected year-2 tax
- $12,342 · $1,028/mo
- Expected delta
- +$6,276/yr (+$523/mo · 103.5%)
ⓘ Screening estimate from a state-policy table — verify with the county assessor before closing.
Climate risk First Street
- Flood 1/10 Low FEMA zone X (unshaded) · 0% chance over 30 yrs
- Wildfire 3/10 Moderate
- Heat 6/10 Major 7 d/yr ≥97°F today · 17 d/yr by 30 yrs out
- Wind 6/10 Major 67% chance of damaging wind over 30 yrs
- Air quality 3/10 Moderate 2 unhealthy d/yr today · 3 by 30 yrs out
Nearby sold comps map
Loading sold comps map…
Walkable amenities ~0.75 mi
Loading nearby amenities…
Taxation est. · year 1
- Rental income
- $114,912
- − Mortgage interest
- −$48,734
- − Property taxes
- −$6,065
- − Insurance
- −$4,350
- − Repairs & maintenance
- −$9,193
- − Management
- −$9,193
- − Depreciation
- −$25,309
- Taxable income
- $12,068
- Est. tax owed @ 24.0%
- −$2,896
- After-tax cash flow
- $22,721/yr
For passive investors: Depreciation is non-cash, so a rental often shows a tax loss while cash-flowing — sheltering income. Rental losses are passive: they offset passive income freely, and up to $25,000/yr can offset ordinary (W-2) income if you actively participate and your MAGI is under $100k (phasing out to $0 by $150k); unused losses carry forward. On sale, claimed depreciation is recaptured at up to 25%, and gains may owe capital-gains tax (a 1031 exchange can defer both). Figures are a year-1 estimate at your 24.0% rate — not tax advice; consult a CPA.
Schools (NCES district)
- District
- Norwich School District
- NCES district ID
- 0903120
- Math proficiency
- 19% ▼ -8.00%
- Reading proficiency
- 29% ▼ -7.00%
- Median HH income
- $50,813
- Composite
- 21.27/100
- National rank
- #8395
- State rank
- #139 of 153 in CT
Livability — Norwich
- Score
- 81/100
- State rank
- #18
- US rank
- #1391
Category grades
Schools grade is shown separately in the Schools card above.
Census & demographics
- Census place
- Norwich, CT
- County
- New London County · 147,197 people
- City population
- 37,216
- Metro
- Norwich-New London, CT
- Population (ZIP)
- 37,216
- Household income
- $65,539
- Rent vs Own
- Severe rent burden
- 1643.0
Population outlook (Southeastern Connecticut County) Hauer SSP2
- By 2040
- 293,442
Race, ethnicity, and origin ACS 2023
- Neighborhood character
- Diverse neighborhood (Simpson 0.63)
- Race & ethnicity
- White 56% Hispanic / Latino 21% Two or more races 12% Black 10% Asian 7%
- Hispanic origin (detail)
- Mexican 3% Puerto Rican 9% Cuban 1% Dominican 3%
- Common ancestry
- Lithuanian 8% Romanian 5% Hispanic 4%
- Foreign-born
- 15% · Canada, China
- Languages at home
- 77% English-only · Spanish 11% French/Haitian/Cajun 4% Chinese 3%
Political lean MEDSL · Southeastern Connecticut
- 2024 margin
- D (+13.0) · D 55.6% · R 42.6% · Other 1.8%
- All cycles
- 2024: D+13.0
Not yet ingested
- Civics
- —
Market trends
- HPI YoY
- ▼ -65.27%
- Current HPI
- 261.8575
- Rent YoY
- ▲ 6.62%
- Metro
- Norwich-New London, CT
- State GDP YoY
- ▲ 1.06%
- F500 in state
- 38
Industry mix (Fortune 500 HQ in CT)
| Industry | F500 HQs | Revenue |
|---|---|---|
| Industrial Machinery | 4 | $38B |
|
||
| Insurance | 3 | $71B |
|
||
| Financial Services | 2 | $25B |
|
||
| Transportation / Logistics | 2 | $18B |
|
||
| Healthcare | 1 | $247B |
|
||
| Telecommunications | 1 | $55B |
|
||
Price history
-99.8% since first listed7 events — show timeline
- 2026-05-17 Rental Removed $1,675 SHOWMOJO
- 2026-05-09 Listed for Rent $1,675 SHOWMOJO
- 2026-04-26 Rental Removed $1,100 SHOWMOJO
- 2026-04-25 Rental Removed $1,100 SHOWMOJO
- 2026-03-25 Listed for Rent $1,100 SHOWMOJO
- 2026-03-25 Listed for Rent $1,750 SHOWMOJO
- 2026-01-28 Listed $900,000 Smart MLS
Property tax history
-1.0%/yrLatest (2023): $6,065 · +0.3% YoY. Source: county tax records.
Cash-flow waterfall
monthlySold comps — $/sqft
last 12 mo · ≤1 miLoading sold comps…