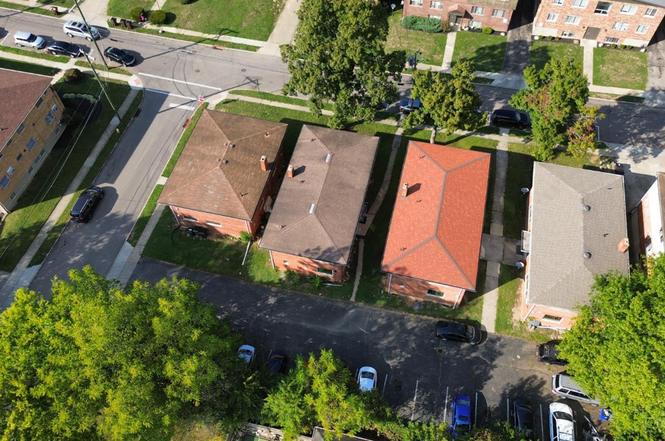
2541 Vera Ave
Golf Manor, OH 45237
$352,000C+
None bd · None ba ·
— sqft ·
Built 1958
· MultiFamily
· Active
· 239 DOM
Cashflow @ list (25.0% down · 7.5%)
Estimated rent
$4,320/mo
Mortgage (P&I)
−$1,846
Tax + insurance
−$617
HOA
−$0
Vac / Maint / Mgmt
−$907
Net cashflow
$950/mo
Annual
$11,396/yr
Cap rate
9.53%
Cash-on-cash
11.56%
DSCR
1.51
1% rule
1.23%
Cash to close
$98,560
Investor read
- This is a 4 × 1-bed/1.0-bath units multifamily listed at $352k.
- At list price, monthly cash flow is $950 ($11k/yr) — positive. Per door: $237/mo.
- The deal already cash-flows at list — no discount required.
- Meets the 1% rule at list price ($4k rent vs $352k).
- It's been on market 239 days — a 12% lower offer ($310k) is reasonable based on typical stale-listing flexibility.
- Recommended offer: $310k (12.0% below list) — sets the bar for market timing.
- Local home prices are declining (-3.0%/yr); year-one equity from $2k of loan paydown is wiped out by about $11k of value loss. Plan a longer hold.
- Location reads 80/100 on livability (#108 in OH, #1,631 nationally) — a professional / high-income tenant draw. Strengths: commute A+, cost of living A+, housing A+; Watch: amenities F.
- Cincinnati Public Schools (urban): math 25% / reading 36% proficiency, ranked #581 of 656 in OH (top 89%) — families likely to look elsewhere, expect single-tenant / working-renter base with shorter leases; 70% free/reduced lunch — lower-income household profile, screen leases tightly.
- Watch-outs: built in 1958 — expect roof / HVAC / electrical / plumbing capex.
- Market conditions: Rents rising fast (+6.6%/yr); 44 active listings in the ZIP; 40 comparable units currently listed for rent nearby; rentals at typical pace (median 24d on market — plan ~3-4 weeks tenant-placement turnaround); lower-income renter base — watch delinquency; 801 units permitted in Hamilton County in 2024 (190 in 5+ unit buildings).
- 5 sale attempts since 21y ago with the ask held roughly flat each time — persistent listings suggest the price (not the market) is what's stuck; bring a comps-based counter.
- Current owner paid $300k; 17% above their basis — modest negotiation headroom, anchor on the comps not their cost.
- At projected returns (-3.0% appreciation + 6.6% rent growth), your $99k cash investment doubles in ~8 years — after that, you're playing with house money.
- Climate carrying-cost: extreme-heat days projected 7→19/yr by 2055 (HVAC capex compounding) — expect insurance premiums to compound above CPI over the hold.
- At $4,320/mo this rent would consume 115% of the median local household income ($45k/yr) (locally 1467% of renters already pay >50% of income on rent) — very limited rent-growth headroom before tenants either downsize or default.
Questions for listing agent
- It's been on market 239 days. Have you received any prior offers? Is the seller open to a 12% concession, seller financing, or rate buy-down credit?
- Can we see the unit-by-unit rent roll, current vacancy, and any below-market leases? What's the average tenancy length?
- What capital expenditures (roof, boiler, parking lot, exteriors) have been made in the last 5 years, and what's planned in the next 2?
- Built in 1958 — when were the roof, HVAC, electrical panel, plumbing, and water heater last replaced?
- Why hasn't it sold? Are there any deal-killer items the seller is aware of (foundation, flood, title, zoning, code violations)?
- Is there a deadline driving the sale (1031 exchange, divorce, estate, relocation)? That informs how much negotiation room exists.
- Schools are B-rated — typically a magnet for longer-tenancy family renters. What's the average tenant stay here, and is there a school-zone premium baked into asking?
- What's the average days-on-market for RENTAL listings here right now (not sales)? A rising rental-DOM trend means longer vacancies and softer asking-rent achievability than the comps imply.
CashFlowRE · CFR-06ARWR2TP1SBTK
· Data 2 days ago
cashflowre.app · 2026-05-29