 Fourplex
2541 Vera Ave · Golf Manor, OH
Flood risk 1/10 · Minimal
- FEMA flood zone
- X (unshaded)
- Chance of flooding over 30 yrs
- 0.0%
- Est. flood insurance / yr
- $507 – $1,088
Fire risk 1/10 · Minimal
- Est. fire insurance / yr
- $713 – $1,323
Heat risk 5/10 · Moderate
- Hot days now (above 103°F)
- 7 days/yr
- Hot days in 30 yrs
- 19 days/yr
Wind risk 2/10 · Minimal
- Chance of severe wind over 30 yrs
- 1.0%
Air-quality risk 4/10 · Minor
- Unhealthy air days now
- 4 days/yr
- Unhealthy air days in 30 yrs
- 5 days/yr
Risk factors via First Street. Map © Google.
Why this score? — see what drove the C+ grade
The composite is a weighted blend of 9 inputs, each scored 0–100. Each bar is that input's sub-score; the figure is the points it added to the 100-point composite (weight × sub-score).
- Cash flow +26.7/30.0
- DSCR +9.1/10.0
- ARV discount +7.5/15.0
- 1% rule +7.3/10.0
- Rent growth +4.2/5.0
- Livability +4.0/5.0
- Schools +2.5/10.0
- Condition / age +2.5/5.0
- Appreciation +0.0/10.0
$352,000
🖨 Deal sheet 📄 Offer letter ✓ Due diligence
Multi-family units
County records classify this as Multi-Family (5+ Unit). Listing-text estimate: 4 units. estimate disagrees with records
5+ unit building — per-unit beds/baths from public records are typically unavailable; the breakdown below (if shown) is an estimate from the listing text.
Listing remarks
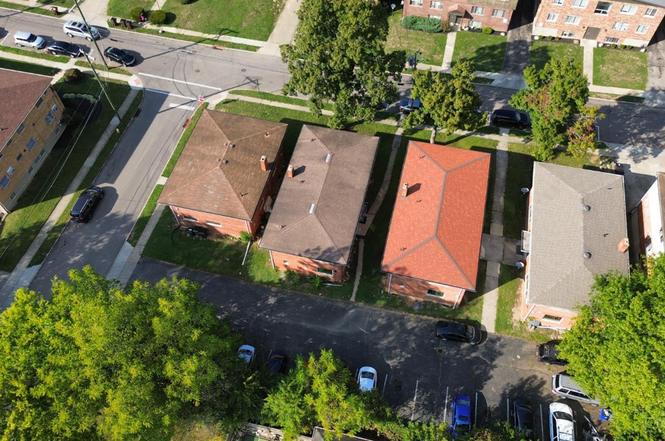
Investment Opportunity - Beautifully Renovated Fourplex in Golf Manor! To be sold together with the 3 adjacent fourplex buildings (attached pictures come from all four buildings). Take advantage of this opportunity to acquire four fourplexes (16 total units). Each of the four buildings include four beautifully renovated and spacious studio apartments (~600 sq ft per unit), and all four buildings share a private, on-site parking lot, streamlining access and enhancing tenant convenience. 14 of the 16 units have been fully renovated, featuring modern finishes, updated kitchens and baths, new flooring, fixtures, and fresh paint minimizing near-term capital expenditure. The remaining 2 units are
Key facts
- Updated baths
- Renovated fourplex
- New flooring
Tags
Property features AI
Finance
- Other: Property located in Golf Manor suburb
- Financial info: Semi-annual tax amount provided but omitted per instructions
- HOA & community: HOA information not provided
Exterior
- Parking: Lot parking (private)
- Security: Security features not provided
- Utilities: Public water; Public sewer; Natural gas
- Home design: Quadruplex (four-unit property); Two levels
- Construction: Brick construction; Poured foundation; Shingle roof; Built year not provided
- Exterior features: Private lot
Interior
- Kitchen: Kitchen details not provided
- Bedrooms: Total of 4 units (bedroom counts per unit not provided)
- Flooring: Flooring details not provided
- Bathrooms: Bathroom details not provided
- Heating & cooling: Baseboard heating; Electric heating; Heat pump; Wall-unit cooling
- Interior features: Full basement; Four-unit building
- Laundry & utility: Laundry details not provided
Neighborhood map
What this means for you Summary
Snapshot
- This is a 4 × 1-bed/1.0-bath units multifamily listed at $352k.
Deal economics
- At list price, monthly cash flow is $950 ($11k/yr) — positive. Per door: $237/mo.
- The deal already cash-flows at list — no discount required.
- Meets the 1% rule at list price ($4k rent vs $352k).
- Recommended offer: $310k (12.0% below list) — sets the bar for market timing.
Location & tenants
- Location reads 80/100 on livability (#108 in OH, #1,631 nationally) — a professional / high-income tenant draw. Strengths: commute A+, cost of living A+, housing A+; Watch: amenities F.
- Cincinnati Public Schools (urban): math 25% / reading 36% proficiency, ranked #581 of 656 in OH (top 89%) — families likely to look elsewhere, expect single-tenant / working-renter base with shorter leases; 70% free/reduced lunch — lower-income household profile, screen leases tightly.
- Market conditions: Rents rising fast (+6.6%/yr); 44 active listings in the ZIP; 40 comparable units currently listed for rent nearby; rentals at typical pace (median 24d on market — plan ~3-4 weeks tenant-placement turnaround); lower-income renter base — watch delinquency; 801 units permitted in Hamilton County in 2024 (190 in 5+ unit buildings).
- At $4,320/mo this rent would consume 115% of the median local household income ($45k/yr) (locally 1467% of renters already pay >50% of income on rent) — very limited rent-growth headroom before tenants either downsize or default.
Forward outlook
- Local home prices are declining (-3.0%/yr); year-one equity from $2k of loan paydown is wiped out by about $11k of value loss. Plan a longer hold.
- At projected returns (-3.0% appreciation + 6.6% rent growth), your $99k cash investment doubles in ~8 years — after that, you're playing with house money.
Negotiation context
- It's been on market 239 days — a 12% lower offer ($310k) is reasonable based on typical stale-listing flexibility.
- 5 sale attempts since 21y ago with the ask held roughly flat each time — persistent listings suggest the price (not the market) is what's stuck; bring a comps-based counter.
- Current owner paid $300k; 17% above their basis — modest negotiation headroom, anchor on the comps not their cost.
Risks & watch-outs
- Watch-outs: built in 1958 — expect roof / HVAC / electrical / plumbing capex.
- Climate carrying-cost: extreme-heat days projected 7→19/yr by 2055 (HVAC capex compounding) — expect insurance premiums to compound above CPI over the hold.
Questions for the listing agent
- It's been on market 239 days. Have you received any prior offers? Is the seller open to a 12% concession, seller financing, or rate buy-down credit?
- Can we see the unit-by-unit rent roll, current vacancy, and any below-market leases? What's the average tenancy length?
- What capital expenditures (roof, boiler, parking lot, exteriors) have been made in the last 5 years, and what's planned in the next 2?
- Built in 1958 — when were the roof, HVAC, electrical panel, plumbing, and water heater last replaced?
- Why hasn't it sold? Are there any deal-killer items the seller is aware of (foundation, flood, title, zoning, code violations)?
- Is there a deadline driving the sale (1031 exchange, divorce, estate, relocation)? That informs how much negotiation room exists.
- Schools are B-rated — typically a magnet for longer-tenancy family renters. What's the average tenant stay here, and is there a school-zone premium baked into asking?
- What's the average days-on-market for RENTAL listings here right now (not sales)? A rising rental-DOM trend means longer vacancies and softer asking-rent achievability than the comps imply.
- What's the recent tenant-quality profile in this submarket — average credit score on applications, eviction rate, late-payment / NSF rate, and stable-employment percentage? A property-management company in the area should have these aggregated.
- How much new apartment / multifamily construction is in the pipeline within 1–3 miles? Heavy new supply (>2% of stock underway) typically softens rents 12–24 months out; light construction supports rent growth.
Investment metrics
- 1% rule
- 1.23% ✓
- Cap rate
- 9.53%
- Cash-on-cash
- 11.56%
- DSCR
- 1.51
- GRM
- 6.8
CMA / ARV
No comps found within radius.
Show comp detail 8 sales within ~0.75 mi
| Address | Dist | Beds/Ba | Sqft | Sold | Price | $/sf | Match |
|---|---|---|---|---|---|---|---|
| 2344 Losantiville Ave | 0.35mi | 6/4.0 | — | 2mo | $325,000 | — | 69 |
| 2365 Vera Ave | 0.31mi | 4/2.0 | 2,114 | 6mo | $327,000 | $155 | 68 |
| 2412 Vera Ave | 0.24mi | 4/2.0 | 2,261 | 10mo | $300,000 | $133 | 68 |
| 6317 Girard Ave | 0.36mi | 4/4.0 | — | 7mo | $460,000 | — | 65 |
| 6305 Englewood Ave | 0.32mi | 14/6.0 | — | 11mo | $430,000 | — | 63 |
| 6205 Lisbon Ave | 0.50mi | 4/2.0 | 2,314 | 6mo | $360,000 | $156 | 59 |
| 6227 Stover Ave | 0.69mi | 6/— | — | 8mo | $310,000 | — | 49 |
| 6118 Stover Ave | 0.72mi | 14/6.0 | — | 16mo | $413,000 | — | 41 |
Match score weights: distance 35% · size 25% · config 20% · recency 20%. Top-matched comps best support the ARV.
Projected returns pro-forma
-3.0% appreciation · 6.62% rent growth · sell at horizon
- IRR
- 5.0%
- Equity multiple
- 1.20×
- Total profit
- $19,836
- Equity at exit
- $52,484
- IRR
- 17.6%
- Equity multiple
- 2.70×
- Total profit
- $167,592
- Equity at exit
- $30,435
Cash invested: $98,560 (down + closing). Projections, not guarantees.
Landlord ↔ Tenant lean methodology
- Overall (STATE)
- 73 Landlord-Friendly
- State Ohio
- 73 Landlord-Friendly · R+6
- County
- — inherits STATE
- City
- — inherits STATE
ZIP-level market 45237
- Home prices YoY
- -33.0%
- Rents YoY
- 6.6%
- Active inventory
- 44
- Price-to-rent
- 27.2×
Monthly cashflow live
- Estimated rent
- $4,320 high interval (Pro) →
- Mortgage (P&I)
- −$1,846
- Tax from tax record
- −$471 /mo · $5,646/yr
- Insurance
- −$147
- HOA
- −$0
- Vacancy / Maint / Mgmt
- −$907
- Net cashflow
- $950
Break-even live
4-unit breakdown (identical units grouped — click to expand)
| Units | Beds | Baths | Est. rent |
|---|---|---|---|
| 4× units | 1 | 1 | $4,320 |
| #1 | 1 | 1 | $1,080 |
| #2 | 1 | 1 | $1,080 |
| #3 | 1 | 1 | $1,080 |
| #4 | 1 | 1 | $1,080 |
| Total (4 units) | $4,320 | ||
UW: 25.0% down · 7.5% · 30yr · 1.5% tax · 5.0% vac · 8.0% maint · 8.0% mgmt
Financing live
Cash to close
- Down payment
- $88,000
- Closing costs
- $10,560
- Reserves months
- —
- Total cash needed
- —
Loan-product check · same deal, 3 products live
Conventional
25% down · 7.5% · 30yr
- Down + closing
- —
- Monthly P&I
- —
- Monthly cashflow
- —
- DSCR
- —
- Eligible?
- —
Personal DTI + credit; lowest rate.
DSCR
20% down · 8.5% · 30yr
- Down + closing
- —
- Monthly P&I
- —
- Monthly cashflow
- —
- DSCR
- —
- Eligible?
- —
No personal income docs; deal must DSCR.
Hard money
10% down · 12.0% · 12mo
- Down + closing
- —
- Monthly P&I
- —
- Monthly cashflow
- —
- DSCR
- —
- Eligible?
- —
Short-term bridge; refi at stabilization.
Rent comps 40 comps
| Address | Beds | Baths | Sqft | Rent | $/sqft | DOM | Units | Dist |
|---|---|---|---|---|---|---|---|---|
| 2769 Losantiville Ave Apt 2 Cincinnati, OH | 1.0 | 1.0 | 650 | $1,150 | $1.77 | 16d | 1 | 0.37mi |
| 2769 Losantiville Ave Apt 2 Cincinnati, OH | 1.0 | 1.0 | 750 | $1,150 | $1.53 | 10d | 1 | 0.37mi |
| 6313 Girard Ave Unit 1 Cincinnati, OH | 1.0 | 1.0 | 770 | $945 | $1.23 | 21d | 1 | 0.37mi |
| 6313 Girard Ave Unit 2 Cincinnati, OH | 1.0 | 1.0 | 770 | $895 | $1.16 | 23d | 1 | 0.37mi |
| 2858 Losantiville Ave Cincinnati, OH | 2.0 | 2.5 | 1800 | $1,950 | $1.08 | 23d | 1 | 0.45mi |
| 2929 Cortelyou Pl Cincinnati, OH | 2.0 | 1.0 | 1198 | $1,425 | $1.19 | 23d | 1 | 0.57mi |
| 6202 Cortelyou Ave Unit 1 Cincinnati, OH | 2.0 | 1.0 | — | $1,200 | — | 23d | 1 | 0.72mi |
| 6119 Stover Ave Unit 6119 2 Cincinnati, OH | 2.0 | 1.0 | 1000 | $1,250 | $1.25 | 23d | 1 | 0.74mi |
| 1969 Section Rd Cincinnati, OH | 1.0 | 1.0 | 660 | $900 | $1.36 | 23d | 1 | 0.79mi |
| 7080 Eastlawn Dr Unit 7080 2 Cincinnati, OH | 1.0 | 1.0 | 700 | $850 | $1.21 | 2d | 1 | 0.84mi |
| 7159 Eastlawn Dr Apt 5 Cincinnati, OH | 1.0 | 1.0 | 750 | $900 | $1.20 | 23d | 1 | 0.85mi |
| 1869 Losantiville Ave Cincinnati, OH | 1.0 | 1.0 | 650 | $850 | $1.31 | 23d | 1 | 0.86mi |
| 7147 Eastlawn Dr Apt 4 Cincinnati, OH | 3.0 | 1.0 | 1100 | $1,600 | $1.45 | 2d | 1 | 0.86mi |
| 6020 Montgomery Rd Cincinnati, OH | 2.0 | 1.0–2.0 | 893 | $3,199 | $3.58 | 1d | 25 | 0.88mi |
| 5739 Montgomery Rd Unit 3 Cincinnati, OH | 2.0 | 1.0 | 850 | $1,020 | $1.20 | 23d | 1 | 0.89mi |
| 6140 Ridge Ave Apt 3 Cincinnati, OH | 1.0 | 1.0 | 700 | $1,175 | $1.68 | 23d | 1 | 0.91mi |
| 5701 Montgomery Rd Cincinnati, OH | 2.0 | 1.5 | — | $1,595 | — | 23d | 1 | 0.92mi |
| 6087 Montgomery Rd Unit 3 Cincinnati, OH | 1.0 | 1.0 | 850 | $1,300 | $1.53 | 4d | 1 | 0.93mi |
| 3163 Woodford Rd Cincinnati, OH | 1.0–2.0 | 1.0–1.5 | 862 | $1,399 | $1.62 | 1d | 14 | 0.96mi |
| 2928 Colonial Ridge Ct Cincinnati, OH | 1.0–2.0 | 1.0 | 812 | $1,520 | $1.87 | 4d | 8 | 0.98mi |
| 5563 Bosworth Pl Unit 2 Cincinnati, OH | 1.0 | 1.0 | — | $925 | — | 23d | 1 | 1.00mi |
| 1811 Losantiville Ave Cincinnati, OH | 1.0 | 1.0 | — | $780 | — | 23d | 1 | 1.00mi |
| 7352 Reading Rd Unit 7352-3 Cincinnati, OH | 1.0 | 1.0 | 800 | $995 | $1.24 | 14d | 1 | 1.02mi |
| 1992 E Seymour Ave Cincinnati, OH | 2.0 | 1.0 | 767 | $1,325 | $1.73 | 4d | 7 | 1.02mi |
| 7209 Brookcrest Dr Unit 2 Cincinnati, OH | 2.0 | 1.0 | 1100 | $1,395 | $1.27 | 16d | 1 | 1.03mi |
| 7209 Brookcrest Dr Unit 1 Cincinnati, OH | 2.0 | 1.0 | 1100 | $1,395 | $1.27 | 4d | 1 | 1.03mi |
| 2529 Lysle Ln #2 Cincinnati, OH | 1.0 | 1.0 | 720 | $1,155 | $1.60 | 43d | 1 | 1.05mi |
| 5529 Bosworth Pl Unit 2 Cincinnati, OH | 1.0 | 1.0 | 700 | $925 | $1.32 | 4d | 1 | 1.06mi |
| 6300 Montgomery Rd Cincinnati, OH | 1.0–2.0 | 1.0–1.5 | 800 | $1,335 | $1.67 | 1d | 3 | 1.09mi |
| 1635 Section Rd Unit 3 Cincinnati, OH | 2.0 | 1.0 | 1500 | $995 | $0.66 | 23d | 1 | 1.10mi |
| 5828 Ridge Ave Unit 5 Cincinnati, OH | 1.0 | 1.0 | 650 | $1,100 | $1.69 | 23d | 1 | 1.11mi |
| 6330 Montgomery Rd Unit 6330 9 Cincinnati, OH | 3.0 | 1.5 | — | $1,595 | — | 23d | 1 | 1.12mi |
| 5824 Ridge Ave Unit 6 Cincinnati, OH | 1.0 | 1.0 | 600 | $895 | $1.49 | 23d | 1 | 1.12mi |
| 6330 Montgomery Rd Unit 6330 7 Cincinnati, OH | 1.0 | 1.0 | — | $850 | — | 23d | 1 | 1.13mi |
| 6142 Dryden Ave Unit 4 Cincinnati, OH | 2.0 | 1.0 | 950 | $1,250 | $1.32 | 23d | 1 | 1.15mi |
| 6419 Montgomery Rd Apt 1B Cincinnati, OH | 1.0 | 1.0 | 750 | $1,100 | $1.47 | 23d | 1 | 1.18mi |
| 7740 Stillwell Rd Unit 1 Cincinnati, OH | 1.0 | 1.0 | 1000 | $975 | $0.97 | 4d | 1 | 1.18mi |
| 7740 Stillwell Rd Cincinnati, OH | 1.0 | 1.0 | 1000 | $975 | $0.97 | 23d | 1 | 1.18mi |
| 6402 Montgomery Rd Apt 5 Cincinnati, OH | 1.0 | 1.0 | 800 | $1,199 | $1.50 | 4d | 1 | 1.19mi |
| 1627 Summit Rd Unit 4 Cincinnati, OH | 1.0 | 1.0 | 750 | $800 | $1.07 | 23d | 1 | 1.20mi |
Listing history 28 events
-
2026-06-18days on market $352,000 Active 239 DOM
-
2026-06-17days on market $352,000 Active 238 DOM
-
2026-06-16days on market $352,000 Active 237 DOM
-
2026-06-15statusdays on market $352,000 Active 236 DOM
-
2026-06-13days on market $352,000 Contingency Pending 234 DOM
-
2026-06-13days on market $352,000 Contingency Pending 233 DOM
-
2026-06-09days on market $352,000 Contingency Pending 230 DOM
-
2026-06-08days on market $352,000 Contingency Pending 229 DOM
-
2026-06-07days on market $352,000 Contingency Pending 228 DOM
-
2026-06-03days on market $352,000 Contingency Pending 224 DOM
-
2026-06-02days on market $352,000 Contingency Pending 223 DOM
-
2026-06-01days on market $352,000 Contingency Pending 222 DOM
-
2026-05-31days on market $352,000 Contingency Pending 221 DOM
-
2026-03-16historical Contingency Pending
-
2025-12-15status Active
-
2025-11-17historical Contingency Pending
-
2025-10-21$352,000 Active
-
2014-05-21soldstatus $300,000
-
2010-07-26soldstatus $37,500
-
2009-06-26historical
-
2009-03-02$79,900
-
2009-02-12historical
-
2008-08-08$90,900
-
2008-01-10soldstatus $107,100
-
2006-02-02historical
-
2005-09-26$117,900
-
2004-11-04soldstatus $103,000
-
2004-02-11soldstatus $93,000
ⓘ Source: listings_history table (triggers on properties + properties_extension) + one-shot
backfill from property_details.listing_events for pre-trigger history.
Tax reassessment forecast OH · Partial reset (capped growth)
- Current annual tax
- $5,646 · $471/mo
- Projected year-2 tax
- $5,646 · $471/mo
- Expected delta
- $0/yr ($0/mo · 0.0%)
ⓘ Screening estimate from a state-policy table — verify with the county assessor before closing.
Climate risk First Street
- Flood 1/10 Low FEMA zone X (unshaded) · 0% chance over 30 yrs
- Wildfire 1/10 Low
- Heat 5/10 Major 7 d/yr ≥103°F today · 19 d/yr by 30 yrs out
- Wind 2/10 Low 100% chance of damaging wind over 30 yrs
- Air quality 4/10 Moderate 4 unhealthy d/yr today · 5 by 30 yrs out
Nearby sold comps map
Loading sold comps map…
Walkable amenities ~0.75 mi
Loading nearby amenities…
Taxation est. · year 1
- Rental income
- $51,840
- − Mortgage interest
- −$19,717
- − Property taxes
- −$5,646
- − Insurance
- −$1,760
- − Repairs & maintenance
- −$4,147
- − Management
- −$4,147
- − Depreciation
- −$10,240
- Taxable income
- $6,182
- Est. tax owed @ 24.0%
- −$1,484
- After-tax cash flow
- $9,913/yr
For passive investors: Depreciation is non-cash, so a rental often shows a tax loss while cash-flowing — sheltering income. Rental losses are passive: they offset passive income freely, and up to $25,000/yr can offset ordinary (W-2) income if you actively participate and your MAGI is under $100k (phasing out to $0 by $150k); unused losses carry forward. On sale, claimed depreciation is recaptured at up to 25%, and gains may owe capital-gains tax (a 1031 exchange can defer both). Figures are a year-1 estimate at your 24.0% rate — not tax advice; consult a CPA.
Schools (NCES district)
- District
- Cincinnati Public Schools
- NCES district ID
- 3904375
- Math proficiency
- 25% ▼ -19.00%
- Reading proficiency
- 36% ▼ -14.00%
- Median HH income
- $35,743
- Composite
- 25.21/100
- National rank
- #7508
- State rank
- #581 of 656 in OH
Livability — Golf Manor
- Score
- 80/100
- State rank
- #108
- US rank
- #1631
Category grades
Schools grade is shown separately in the Schools card above.
Census & demographics
- Census place
- Golf Manor, OH
- County
- Hamilton County · 701,295 people
- Metro
- Cincinnati, OH-KY-IN
- Population (ZIP)
- 20,903
- Household income
- $44,913
- Rent vs Own
- Severe rent burden
- 1467.0
Population outlook (Hamilton County) Hauer SSP2
- Today (2025)
- 826,054 people
- By 2030
- 830,947 · +0.6%
- By 2040
- 832,319 · +0.8%
- By 2050
- 822,428 · -0.4%
- By 2075
- 788,688 · -4.5%
- By 2100
- 710,674 · -14.0%
Race, ethnicity, and origin ACS 2023
- Neighborhood character
- Predominantly Black (71%)
- Race & ethnicity
- Black 71% White 22% Two or more races 4% Hispanic / Latino 2%
- Common ancestry
- Romanian 2% Italian 1% Scotch-Irish 1%
- Foreign-born
- 3% · Canada
- Languages at home
- 96% English-only · Spanish 2%
Political lean MEDSL · Hamilton
- 2024 margin
- D (+14.9) · D 57.0% · R 42.1%
- 2008→2024 swing
- +7.9pp toward D · 2008: 7.0pp · 2024: 14.9pp
- All cycles
- 2024: D+14.9 2020: D+15.9 2016: D+9.5 2012: D+4.9 2008: D+7.0
Not yet ingested
- Civics
- —
Market trends
- HPI YoY
- ▼ -110.54%
- Current HPI
- 224.4728
- Rent YoY
- ▲ 6.62%
- Metro
- Cincinnati, OH-KY-IN
- State GDP YoY
- ▲ 1.98%
- F500 in state
- 48
Industry mix (Fortune 500 HQ in OH)
| Industry | F500 HQs | Revenue |
|---|---|---|
| Insurance | 3 | $145B |
|
||
| Industrial Machinery | 3 | $49B |
|
||
| Financial Services | 3 | $24B |
|
||
| Consumer Goods | 2 | $93B |
|
||
| Aerospace / Defense | 2 | $47B |
|
||
| Utilities | 2 | $33B |
|
||
Price history
+278.5% since first listed15 events — show timeline
- 2026-03-16 Contingent — Cincy MLS
- 2025-12-15 Relisted — Cincy MLS
- 2025-11-17 Contingent — Cincy MLS
- 2025-10-21 Listed $352,000 Cincy MLS
- 2014-05-21 Sold (Public Records) $300,000 Public Records
- 2010-07-26 Sold (Public Records) $37,500 Public Records
- 2009-06-26 Listing Removed — Cincy MLS
- 2009-03-02 Listed $79,900 Cincy MLS
- 2009-02-12 Listing Removed — Cincy MLS
- 2008-08-08 Listed $90,900 Cincy MLS
- 2008-01-10 Sold (Public Records) $107,100 Public Records
- 2006-02-02 Listing Removed — Cincy MLS
- 2005-09-26 Listed $117,900 Cincy MLS
- 2004-11-04 Sold (Public Records) $103,000 Public Records
- 2004-02-11 Sold (Public Records) $93,000 Public Records
Property tax history
+6.5%/yrLatest (2025): $5,646 · +0.6% YoY. Source: county tax records.
Cash-flow waterfall
monthlySold comps — $/sqft
last 12 mo · ≤1 miLoading sold comps…