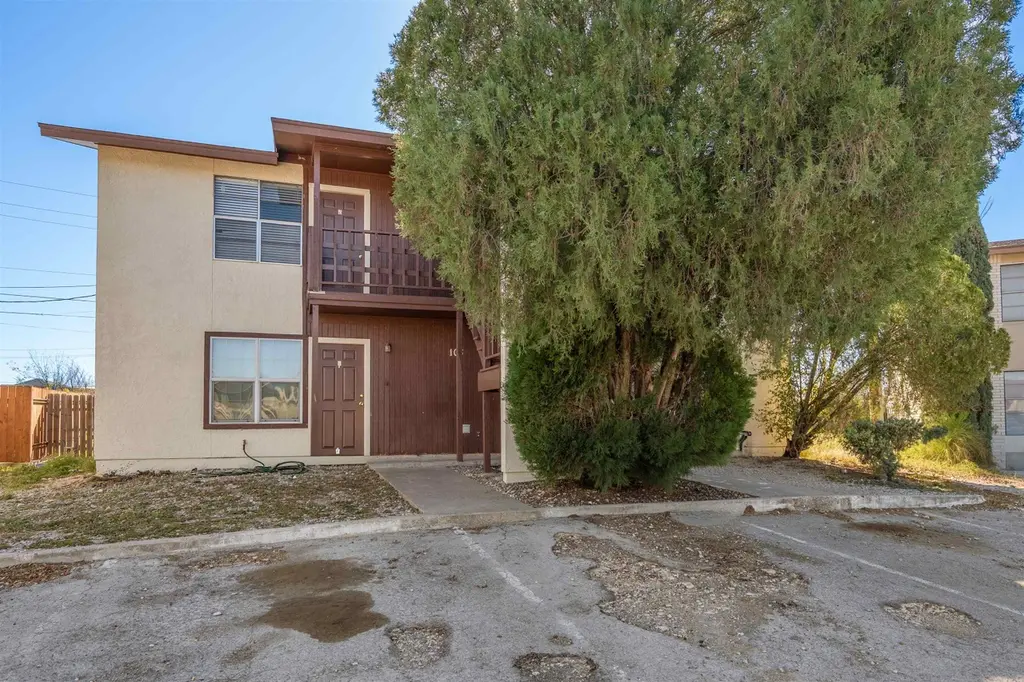
103 Shannon Cir
Del Rio, TX 78840
$359,000C
None bd · 2.0 ba ·
3,680 sqft ·
Built 1983
· MultiFamily
· Active
· 155 DOM
Cashflow @ list (25.0% down · 7.5%)
Estimated rent
$4,241/mo
Mortgage (P&I)
−$1,883
Tax + insurance
−$784
HOA
−$0
Vac / Maint / Mgmt
−$891
Net cashflow
$683/mo
Annual
$8,202/yr
Cap rate
8.58%
Cash-on-cash
8.16%
DSCR
1.36
1% rule
1.18%
Cash to close
$100,520
Investor read
- This is a 4 × 2-bed/1-bath units multifamily listed at $359k.
- At list price, monthly cash flow is $683 ($8k/yr) — positive. Per door: $171/mo.
- The deal already cash-flows at list — no discount required.
- Meets the 1% rule at list price ($4k rent vs $359k).
- It's been on market 155 days — a 12% lower offer ($316k) is reasonable based on typical stale-listing flexibility.
- Recommended offer: $316k (12.0% below list) — sets the bar for market timing.
- Local home prices are declining (-3.0%/yr); year-one equity from $2k of loan paydown is wiped out by about $11k of value loss. Plan a longer hold.
- Location reads 70/100 on livability (#349 in TX) — a middle-class / working-renter tenant base. Strengths: cost of living A+, housing A+, crime A-; Watch: health & safety C-, employment D+, amenities F.
- San Felipe-Del Rio CISD (town): math 25% / reading 32% proficiency, ranked #667 of 826 in TX (top 81%) — low school quality limits family demand, transient renter base, plan for 1-2y turnover; 70% free/reduced lunch — lower-income household profile, screen leases tightly.
- Zoned schools: Dr Lonnie Green Jr El (math 26% / reading 31%, grade F, #2,706 of 4,322 statewide, top 63%, 791 students, 74% FRL); Del Rio Middle (math 26% / reading 43%, grade F, #858 of 1,662 statewide, top 54%, 1,478 students, 74% FRL); Del Rio H S (math 27% / reading 30%, grade F, #1,157 of 1,632 statewide, top 72%, 2,470 students, 65% FRL) — zoned schools at 71% FRL track the district average.
- Market conditions: Rents rising (+1.6%/yr); 549 active listings in the ZIP; 85 units permitted in Val Verde County in 2024 (0 in 5+ unit buildings).
- Val Verde County population projected to shrink 9% by 2050 — rents likely to lag national; underwrite the cash flow, not the appreciation.
- 4 sale attempts since 8y ago; this cycle's ask is 47767% above the opening price — seller raised mid-cycle; expect resistance to lowballs.
- Climate carrying-cost: major wildfire risk; extreme-heat days projected 7→23/yr by 2055 (HVAC capex compounding) — expect insurance premiums to compound above CPI over the hold.
- At $4,241/mo this rent would consume 77% of the median local household income ($66k/yr) (locally 1111% of renters already pay >50% of income on rent) — very limited rent-growth headroom before tenants either downsize or default.
Questions for listing agent
- It's been on market 155 days. Have you received any prior offers? Is the seller open to a 12% concession, seller financing, or rate buy-down credit?
- Can we see the unit-by-unit rent roll, current vacancy, and any below-market leases? What's the average tenancy length?
- What capital expenditures (roof, boiler, parking lot, exteriors) have been made in the last 5 years, and what's planned in the next 2?
- Why hasn't it sold? Are there any deal-killer items the seller is aware of (foundation, flood, title, zoning, code violations)?
- Is there a deadline driving the sale (1031 exchange, divorce, estate, relocation)? That informs how much negotiation room exists.
- Schools are D-rated, which usually means shorter tenancies and higher turnover. Who's the typical renter profile here, and what's been the actual vacancy rate?
- What's the average days-on-market for RENTAL listings here right now (not sales)? A rising rental-DOM trend means longer vacancies and softer asking-rent achievability than the comps imply.
- What's the recent tenant-quality profile in this submarket — average credit score on applications, eviction rate, late-payment / NSF rate, and stable-employment percentage? A property-management company in the area should have these aggregated.
CashFlowRE · CFR-072JEA3NYTM9P4
· Data 2 days ago
cashflowre.app · 2026-05-29