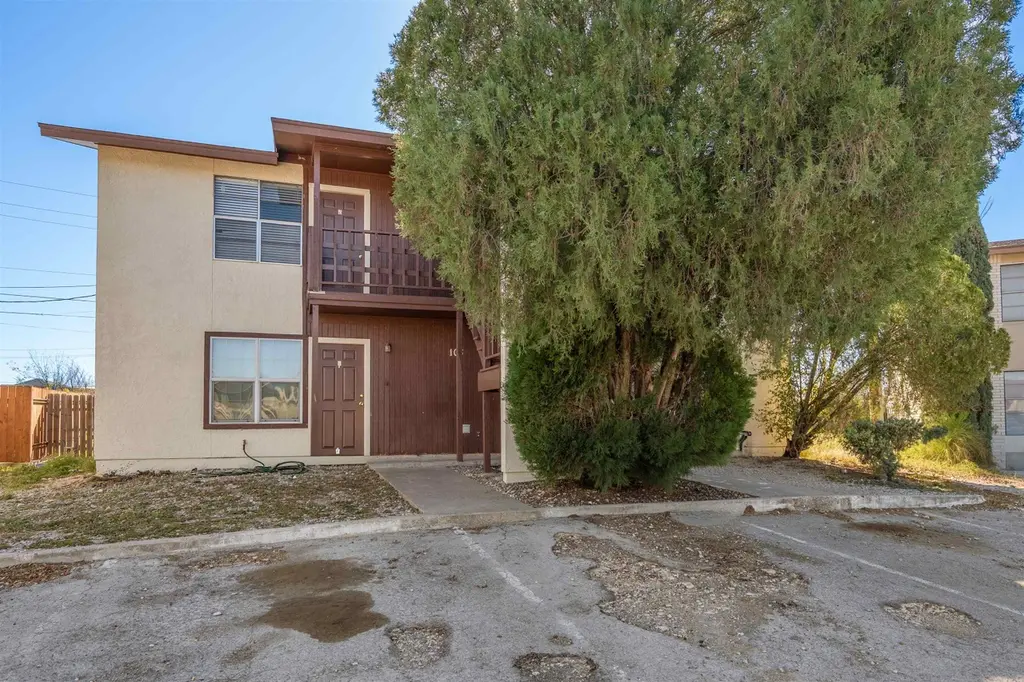
 Fourplex
103 Shannon Cir · Del Rio, TX
Flood risk 1/10 · Minimal
- FEMA flood zone
- X (unshaded)
- Chance of flooding over 30 yrs
- 0.0%
- Est. flood insurance / yr
- $507 – $1,088
Fire risk 6/10 · Moderate
- Est. fire insurance / yr
- $1,222 – $2,270
Heat risk 8/10 · Major
- Hot days now (above 108°F)
- 7 days/yr
- Hot days in 30 yrs
- 23 days/yr
Wind risk 4/10 · Minor
- Chance of severe wind over 30 yrs
- 12.0%
Air-quality risk 1/10 · Minimal
- Unhealthy air days now
- 0 days/yr
- Unhealthy air days in 30 yrs
- 0 days/yr
Risk factors via First Street. Map © Google.
Why this score? — see what drove the C grade
The composite is a weighted blend of 9 inputs, each scored 0–100. Each bar is that input's sub-score; the figure is the points it added to the 100-point composite (weight × sub-score).
- Cash flow +23.7/30.0
- DSCR +7.6/10.0
- ARV discount +7.5/15.0
- 1% rule +6.8/10.0
- Livability +3.5/5.0
- Rent growth +2.9/5.0
- Condition / age +2.5/5.0
- Schools +2.4/10.0
- Appreciation +0.0/10.0
$359,000
🖨 Deal sheet (PDF) 📄 Offer letter ✓ Due diligence
Multi-family units
County records classify this as Multi-Family (2-4 Unit). Listing-text estimate: 4 units. confirmed
Listing remarks MLS
Calling on Investors, Centrally Located Muti-family Unit 4 Plex, all 4 Apartments with 2 Bedrooms, 1 Bathroom, Open Floor Plan, all Kitchen Appliances, Central HVAC, Washer & Dryer Connections and Plenty of Parking. Units Lease with independent electricity with water, trash and sewer paid by the landlord. Only a few city blocks from schools and commercial areas and close to all major shopping & dinning.
Key facts
- Central hvac
- Open floor plan
- Kitchen appliances
Tags
Neighborhood map
What this means for you Summary
Snapshot
- This is a 4 × 2-bed/1-bath units multifamily listed at $359k.
Deal economics
- At list price, monthly cash flow is $683 ($8k/yr) — positive. Per door: $171/mo.
- The deal already cash-flows at list — no discount required.
- Meets the 1% rule at list price ($4k rent vs $359k).
- Recommended offer: $316k (12.0% below list) — sets the bar for market timing.
Location & tenants
- Location reads 70/100 on livability (#349 in TX) — a middle-class / working-renter tenant base. Strengths: cost of living A+, housing A+, crime A-; Watch: health & safety C-, employment D+, amenities F.
- San Felipe-Del Rio CISD (town): math 25% / reading 32% proficiency, ranked #667 of 826 in TX (top 81%) — low school quality limits family demand, transient renter base, plan for 1-2y turnover; 70% free/reduced lunch — lower-income household profile, screen leases tightly.
- Zoned schools: Dr Lonnie Green Jr El (math 26% / reading 31%, grade F, #2,706 of 4,322 statewide, top 63%, 791 students, 74% FRL); Del Rio Middle (math 26% / reading 43%, grade F, #858 of 1,662 statewide, top 54%, 1,478 students, 74% FRL); Del Rio H S (math 27% / reading 30%, grade F, #1,157 of 1,632 statewide, top 72%, 2,470 students, 65% FRL) — zoned schools at 71% FRL track the district average.
- Market conditions: Rents rising (+1.6%/yr); 549 active listings in the ZIP; 85 units permitted in Val Verde County in 2024 (0 in 5+ unit buildings).
- At $4,241/mo this rent would consume 77% of the median local household income ($66k/yr) (locally 1111% of renters already pay >50% of income on rent) — very limited rent-growth headroom before tenants either downsize or default.
Forward outlook
- Local home prices are declining (-3.0%/yr); year-one equity from $2k of loan paydown is wiped out by about $11k of value loss. Plan a longer hold.
- Val Verde County population projected to shrink 9% by 2050 — rents likely to lag national; underwrite the cash flow, not the appreciation.
Negotiation context
- It's been on market 155 days — a 12% lower offer ($316k) is reasonable based on typical stale-listing flexibility.
- 4 sale attempts since 8y ago; this cycle's ask is 47767% above the opening price — seller raised mid-cycle; expect resistance to lowballs.
Risks & watch-outs
- Climate carrying-cost: major wildfire risk; extreme-heat days projected 7→23/yr by 2055 (HVAC capex compounding) — expect insurance premiums to compound above CPI over the hold.
Questions for the listing agent
- It's been on market 155 days. Have you received any prior offers? Is the seller open to a 12% concession, seller financing, or rate buy-down credit?
- Can we see the unit-by-unit rent roll, current vacancy, and any below-market leases? What's the average tenancy length?
- What capital expenditures (roof, boiler, parking lot, exteriors) have been made in the last 5 years, and what's planned in the next 2?
- Why hasn't it sold? Are there any deal-killer items the seller is aware of (foundation, flood, title, zoning, code violations)?
- Is there a deadline driving the sale (1031 exchange, divorce, estate, relocation)? That informs how much negotiation room exists.
- Schools are D-rated, which usually means shorter tenancies and higher turnover. Who's the typical renter profile here, and what's been the actual vacancy rate?
- What's the average days-on-market for RENTAL listings here right now (not sales)? A rising rental-DOM trend means longer vacancies and softer asking-rent achievability than the comps imply.
- What's the recent tenant-quality profile in this submarket — average credit score on applications, eviction rate, late-payment / NSF rate, and stable-employment percentage? A property-management company in the area should have these aggregated.
- How much new apartment / multifamily construction is in the pipeline within 1–3 miles? Heavy new supply (>2% of stock underway) typically softens rents 12–24 months out; light construction supports rent growth.
Investment metrics
- 1% rule
- 1.18% ✓
- Cap rate
- 8.58%
- Cash-on-cash
- 8.16%
- DSCR
- 1.36
- GRM
- 7.1
CMA / ARV
No comps found within radius.
Projected returns pro-forma
-3.0% appreciation · 1.55% rent growth · sell at horizon
- IRR
- -5.6%
- Equity multiple
- 0.80×
- Total profit
- $-20,563
- Equity at exit
- $53,528
- IRR
- 2.2%
- Equity multiple
- 1.14×
- Total profit
- $14,563
- Equity at exit
- $31,040
Cash invested: $100,520 (down + closing). Projections, not guarantees.
Landlord ↔ Tenant lean methodology
- Overall (STATE)
- 87 Strongly Landlord-Friendly
- State Texas
- 87 Strongly Landlord-Friendly · R+5
- County
- — inherits STATE
- City
- — inherits STATE
ZIP-level market 78840
- Home prices YoY
- -33.6%
- Rents YoY
- 1.6%
- Active inventory
- 549
- Price-to-rent
- 28.2×
Monthly cashflow live
- Estimated rent
- $4,241 high interval (Pro) →
- Mortgage (P&I)
- −$1,883
- Tax from tax record
- −$635 /mo · $7,616/yr
- Insurance
- −$150
- HOA
- −$0
- Vacancy / Maint / Mgmt
- −$891
- Net cashflow
- $683
Break-even live
Sensitivity live
| Price | -10% $887 | -5% $785 | +0% $683 | +5% $582 | +10% $480 |
|---|---|---|---|---|---|
| Rent | -10% $348 | -5% $516 | +0% $683 | +5% $851 | +10% $1,019 |
| Rate | -1.0pp $864 | -0.5pp $775 | base $683 | +0.5pp $590 | +1.0pp $496 |
4-unit breakdown (identical units grouped — click to expand)
| Units | Beds | Baths | Est. rent |
|---|---|---|---|
| 4× units | 2 | 1 | $4,240 |
| #1 | 2 | 1 | $1,060 |
| #2 | 2 | 1 | $1,060 |
| #3 | 2 | 1 | $1,060 |
| #4 | 2 | 1 | $1,060 |
| Total (4 units) | $4,241 | ||
UW: 25.0% down · 7.5% · 30yr · 1.5% tax · 5.0% vac · 8.0% maint · 8.0% mgmt
Financing live
Cash to close
- Down payment
- $89,750
- Closing costs
- $10,770
- Reserves months
- —
- Total cash needed
- —
Loan-product check · same deal, 3 products live
Conventional
25% down · 7.5% · 30yr
- Down + closing
- —
- Monthly P&I
- —
- Monthly cashflow
- —
- DSCR
- —
- Eligible?
- —
Personal DTI + credit; lowest rate.
DSCR
20% down · 8.5% · 30yr
- Down + closing
- —
- Monthly P&I
- —
- Monthly cashflow
- —
- DSCR
- —
- Eligible?
- —
No personal income docs; deal must DSCR.
Hard money
10% down · 12.0% · 12mo
- Down + closing
- —
- Monthly P&I
- —
- Monthly cashflow
- —
- DSCR
- —
- Eligible?
- —
Short-term bridge; refi at stabilization.
Listing history 23 events
-
2026-06-19days on market $359,000 Active 155 DOM
-
2026-06-18days on market $359,000 Active 154 DOM
-
2026-06-17days on market $359,000 Active 153 DOM
-
2026-06-16days on market $359,000 Active 152 DOM
-
2026-06-15days on market $359,000 Active 151 DOM
-
2026-06-14days on market $359,000 Active 149 DOM
-
2026-06-12days on market $359,000 Active 148 DOM
-
2026-06-09days on market $359,000 Active 145 DOM
-
2026-06-08days on market $359,000 Active 144 DOM
-
2026-06-07days on market $359,000 Active 143 DOM
-
2026-06-05days on market $359,000 Active 140 DOM
-
2026-06-03days on market $359,000 Active 139 DOM
-
2026-06-02days on market $359,000 Active 138 DOM
-
2026-06-01days on market $359,000 Active 137 DOM
-
2026-05-31days on market $359,000 Active 136 DOM
-
2026-05-30days on market $359,000 Active 135 DOM
-
2026-05-13historical $750
-
2026-05-07$750
-
2026-03-16historical $800
-
2026-01-13$359,000 Active 418-char remark
Show marketing remark (418 chars)
Calling on Investors, Centrally Located Muti-family Unit 4 Plex, all 4 Apartments with 2 Bedrooms, 1 Bathroom, Open Floor Plan, all Kitchen Appliances, Central HVAC, Washer & Dryer Connections and Plenty of Parking. Units Lease with independent electricity with water, trash and sewer paid by the landlord. Only a few city blocks from schools and commercial areas and close to all major shopping & dinning.
-
2025-12-20$800
-
2018-04-27soldstatus 25-char remark
Show marketing remark (25 chars)
GREAT INVESTMENT PROPERTY
-
2018-02-22$195,000 25-char remark
Show marketing remark (25 chars)
GREAT INVESTMENT PROPERTY
ⓘ Source: listings_history table (triggers on properties + properties_extension) + one-shot
backfill from property_details.listing_events for pre-trigger history.
Tax reassessment forecast TX · Resets to sale price
- Current annual tax
- $7,616 · $635/mo
- Projected year-2 tax
- $7,616 · $635/mo
- Expected delta
- $0/yr ($0/mo · 0.0%)
ⓘ Screening estimate from a state-policy table — verify with the county assessor before closing.
Climate risk First Street
- Flood 1/10 Low FEMA zone X (unshaded) · 0% chance over 30 yrs
- Wildfire 6/10 Major
- Heat 8/10 Severe 7 d/yr ≥108°F today · 23 d/yr by 30 yrs out
- Wind 4/10 Moderate 12% chance of damaging wind over 30 yrs
- Air quality 1/10 Low 0 unhealthy d/yr today · 0 by 30 yrs out
Nearby sold comps map
Loading sold comps map…
Walkable amenities ~0.75 mi
Loading nearby amenities…
Taxation est. · year 1
- Rental income
- $50,892
- − Mortgage interest
- −$20,110
- − Property taxes
- −$7,616
- − Insurance
- −$1,795
- − Repairs & maintenance
- −$4,071
- − Management
- −$4,071
- − Depreciation
- −$10,444
- Taxable income
- $2,785
- Est. tax owed @ 24.0%
- −$668
- After-tax cash flow
- $7,534/yr
For passive investors: Depreciation is non-cash, so a rental often shows a tax loss while cash-flowing — sheltering income. Rental losses are passive: they offset passive income freely, and up to $25,000/yr can offset ordinary (W-2) income if you actively participate and your MAGI is under $100k (phasing out to $0 by $150k); unused losses carry forward. On sale, claimed depreciation is recaptured at up to 25%, and gains may owe capital-gains tax (a 1031 exchange can defer both). Figures are a year-1 estimate at your 24.0% rate — not tax advice; consult a CPA.
Schools (NCES district)
- District
- San Felipe-Del Rio CISD
- NCES district ID
- 4838900
- Math proficiency
- 25% ▼ -18.00%
- Reading proficiency
- 32% ▼ -5.00%
- Median HH income
- $40,582
- Composite
- 24.04/100
- National rank
- #7766
- State rank
- #667 of 826 in TX
Livability — Del Rio
- Score
- 70/100
- State rank
- #349
- US rank
- #7531
Category grades
Schools grade is shown separately in the Schools card above.
Census & demographics
- Census place
- Del Rio, TX
- County
- Val Verde County · 47,256 people
- City population
- 47,256
- Metro
- Del Rio, TX
- Population (ZIP)
- 47,256
- Household income
- $66,084
- Rent vs Own
- Severe rent burden
- 1111.0
Population outlook (Val Verde County) Hauer SSP2
- Today (2025)
- 48,073 people
- By 2030
- 47,468 · -1.3%
- By 2040
- 45,930 · -4.5%
- By 2050
- 43,904 · -8.7%
- By 2075
- 38,126 · -20.7%
- By 2100
- 26,217 · -45.5%
Race, ethnicity, and origin ACS 2023
- Neighborhood character
- Predominantly Hispanic (82%)
- Race & ethnicity
- Hispanic / Latino 82% Two or more races 24% White 15% Black 1%
- Hispanic origin (detail)
- Mexican 75%
- Common ancestry
- Italian 1% Lithuanian 1% Slovak 1%
- Foreign-born
- 19% · Canada
- Languages at home
- 36% English-only · Spanish 63%
Political lean MEDSL · Val Verde
- 2024 margin
- Strong R (+26.6) · D 36.2% · R 62.9%
- 2008→2024 swing
- -36.2pp toward R · 2008: 9.6pp · 2024: -26.6pp
- All cycles
- 2024: R+26.6 2020: R+9.9 2016: D+7.9 2012: D+5.4 2008: D+9.6
Not yet ingested
- Civics
- —
Market trends
- HPI YoY
- ▼ -81.95%
- Current HPI
- 161.762
- Rent YoY
- ▲ 1.55%
- Metro
- Del Rio, TX
- State GDP YoY
- ▲ 3.95%
- F500 in state
- 110
Industry mix (Fortune 500 HQ in TX)
| Industry | F500 HQs | Revenue |
|---|---|---|
| Energy | 16 | $1,198B |
|
||
| Technology | 5 | $198B |
|
||
| Engineering / Construction | 4 | $72B |
|
||
| Energy Services | 3 | $60B |
|
||
| Utilities | 3 | $41B |
|
||
| Healthcare | 2 | $330B |
|
||
Price history
+84.1% since first listed7 events — show timeline
- 2026-05-13 Rental Removed $750 DRBORMLS
- 2026-05-07 Listed for Rent $750 DRBORMLS
- 2026-03-16 Rental Removed $800 DRBORMLS
- 2026-01-13 Listed $359,000 DRBORMLS
- 2025-12-20 Listed for Rent $800 DRBORMLS
- 2018-04-27 Sold (MLS) — DRBORMLS
- 2018-02-22 Listed $195,000 DRBORMLS
Property tax history
+12.5%/yrLatest (2025): $7,616 · -9.8% YoY. Source: county tax records.
Cash-flow waterfall
monthlySold comps — $/sqft
last 12 mo · ≤1 miLoading sold comps…