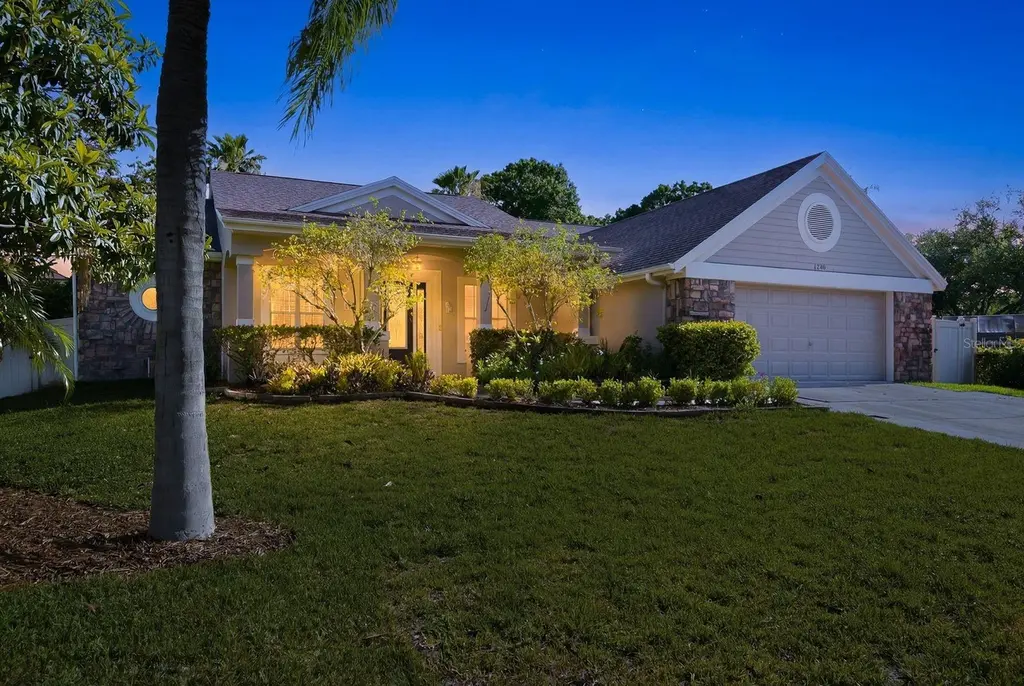
1159 W Curlew Pl
Tarpon Springs, FL 34689
$550,000D
4 bd · 3.5 ba ·
2,354 sqft ·
Built 2000
· SingleFamily
· Active
· 12 DOM
Cashflow @ list (25.0% down · 7.5%)
Estimated rent
$4,175/mo
Mortgage (P&I)
−$2,884
Tax + insurance
−$449
HOA
−$0
Vac / Maint / Mgmt
−$877
Net cashflow
$-35/mo
Annual
$-417/yr
Cap rate
6.22%
Cash-on-cash
-0.27%
DSCR
0.99
1% rule
0.76%
Cash to close
$154,000
Investor read
- This is a 4-bed/3.5-bath single-family listed at $550k.
- At list price, monthly cash flow is $-35 ($-417/yr) — negative.
- To cash-flow at today's rent, offer at most $544k (1.1% below list).
- To meet the 1% rule (rent ≥ 1% of price), the offer needs to be $418k (24.1% below list).
- Only 12 days on market — expect competitive offers; lowballing is unlikely to land.
- Recommended offer: $418k (24.1% below list) — sets the bar for 1% rule.
- Local home prices are declining (-3.0%/yr); year-one equity from $4k of loan paydown is wiped out by about $16k of value loss. Plan a longer hold.
- Location reads 68/100 on livability (#502 in FL) — a middle-class / working-renter tenant base. Strengths: housing A+, cost of living A, schools A-; Watch: employment C-, amenities F, commute F.
- Pinellas (suburban): math 51% / reading 51% proficiency, ranked #31 of 73 in FL (top 42%) — acceptable for families but not a draw, mixed tenant base, ~2y average lease.
- Market conditions: Rents soft (-1.2%/yr); 399 active listings in the ZIP; 4 comparable units currently listed for rent nearby; rentals at typical pace (median 17d on market — plan ~3-4 weeks tenant-placement turnaround); 2,676 units permitted in Pinellas County in 2024 (1,422 in 5+ unit buildings).
- Pinellas County population projected at +14% by 2050 — modest demand growth; plan on rents tracking national, not racing it.
- 4 sale attempts since 22y ago with the ask held roughly flat each time — persistent listings suggest the price (not the market) is what's stuck; bring a comps-based counter.
- Current owner paid $234k; list at $550k implies a 135% gain — meaningful room to come down on a strong offer.
- Climate carrying-cost: moderate flood risk; severe wind risk, 99% chance of damaging wind over 30y; extreme-heat days projected 7→27/yr by 2055 (HVAC capex compounding) — expect insurance premiums to compound above CPI over the hold.
- Cap rate 6.2% vs local median 3.4% in Tarpon Springs — top-decile yield for the area; either an underpriced asset or a hidden risk that comps aren't pricing in. Stress-test before assuming the spread holds.
- At $4,175/mo this rent would consume 67% of the median local household income ($75k/yr) (locally 721% of renters already pay >50% of income on rent) — very limited rent-growth headroom before tenants either downsize or default.
Questions for listing agent
- What do current leases actually rent for vs. the listed asking? Can we see a recent rent roll and the last 12 months of T-12 income?
- Is there a deadline driving the sale (1031 exchange, divorce, estate, relocation)? That informs how much negotiation room exists.
- Schools are A-rated — typically a magnet for longer-tenancy family renters. What's the average tenant stay here, and is there a school-zone premium baked into asking?
- The area grade is low — what's the realistic commute time and amenity access for the typical tenant pool here? Any planned neighborhood developments (good or bad) we should know about?
- What's the average days-on-market for RENTAL listings here right now (not sales)? A rising rental-DOM trend means longer vacancies and softer asking-rent achievability than the comps imply.
- What's the recent tenant-quality profile in this submarket — average credit score on applications, eviction rate, late-payment / NSF rate, and stable-employment percentage? A property-management company in the area should have these aggregated.
- How much new for-sale + rental construction is in the pipeline within 1–3 miles? Heavy new supply typically softens prices + rents 12–24 months out; constrained supply supports both.
CashFlowRE · CFR-07SCQPEBZZWY67
· Data 2 days ago
cashflowre.app · 2026-05-29