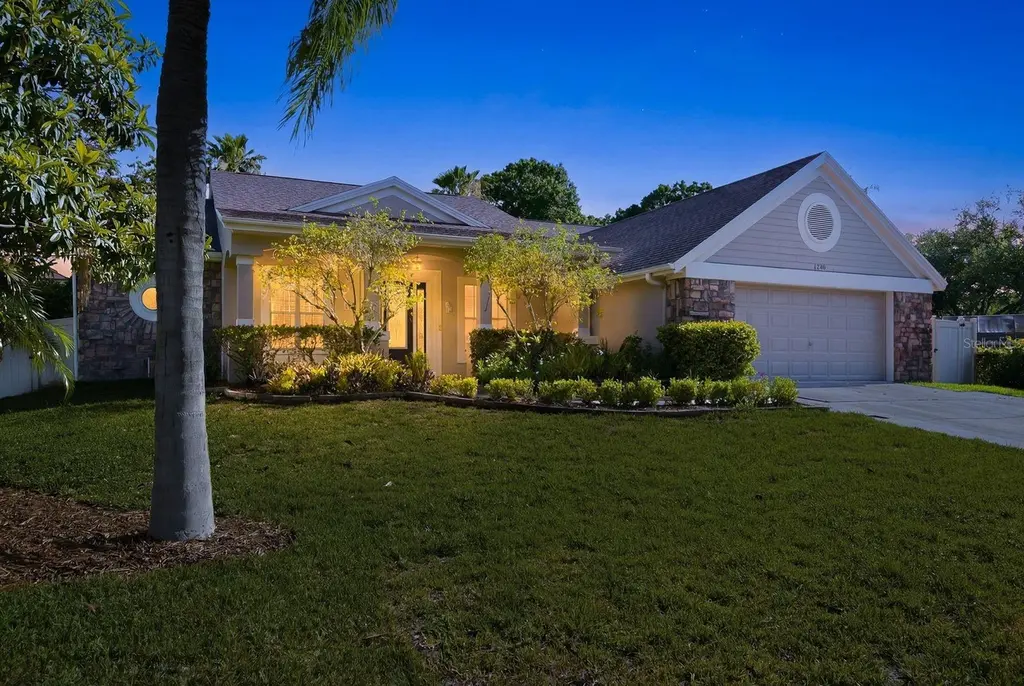
1159 W Curlew Pl · Tarpon Springs, FL
Flood risk 5/10 · Moderate
- FEMA flood zone
- X (unshaded)
- Chance of flooding over 30 yrs
- 0.53%
- Est. flood insurance / yr
- $507 – $1,088
Fire risk 2/10 · Minimal
- Est. fire insurance / yr
- $947 – $1,759
Heat risk 10/10 · Severe
- Hot days now (above 109°F)
- 7 days/yr
- Hot days in 30 yrs
- 27 days/yr
Wind risk 10/10 · Severe
- Chance of severe wind over 30 yrs
- 99.0%
Air-quality risk 3/10 · Minor
- Unhealthy air days now
- 3 days/yr
- Unhealthy air days in 30 yrs
- 3 days/yr
Risk factors via First Street. Map © Google.
Why this score? — see what drove the D grade
The composite is a weighted blend of 9 inputs, each scored 0–100. Each bar is that input's sub-score; the figure is the points it added to the 100-point composite (weight × sub-score).
- Cash flow +13.0/30.0
- ARV discount +12.1/15.0
- Schools +4.3/10.0
- DSCR +3.9/10.0
- Livability +3.4/5.0
- 1% rule +2.6/10.0
- Condition / age +2.5/5.0
- Rent growth +2.2/5.0
- Appreciation +0.0/10.0
$550,000
🖨 Deal sheet 📄 Offer letter ✓ Due diligence
Listing remarks MLS
Fantastic country style home. Huge great room with gas fireplace. Gourmet kitchen with breakfast nook. Neutral colors throughout, ceramic tile, lots of windows and doors. House is very light and bright. Great paved backyard with spa. Top quality construction. Don't miss this home! Great opportunity!
Key facts
- Marble countertops
- Open floorplan
- Dining area
Tags
Property features AI
Finance
- Other: Unfurnished; Living area approximately 2,354 (public records); Total building area approximately 3,326 (public records)
- Financial info: Lease restrictions apply
Exterior
- Parking: Attached garage; 2-car garage
- Utilities: Public water; Public sewer; Broadband/high-speed internet available; Cable available; Electricity connected; Water connected; Sewer connected
- Home design: Single family residence; One story; Faces south; Homestead exempt
- Construction: Block construction; Shingle roof; Slab foundation; Built on 0.24 acre lot (approx. 87 x 120)
- Exterior features: Covered patio/porch; Front porch; Rear porch; Outdoor kitchen; Private mailbox; Irrigation system; Trees and landscaping; Paved road access
Interior
- Kitchen: Dishwasher; Disposal; Microwave; Range; Refrigerator; Stone counters; Eat-in kitchen
- Bedrooms: 4 bedrooms
- Flooring: Bamboo; Ceramic tile; Laminate
- Bathrooms: 3 full bathrooms
- Heating & cooling: Central heating; Central air conditioning
- Interior features: Ceiling fans; Eat-in kitchen; High ceilings; Living room / dining room combo; Open floorplan; Stone counters; Walk-in closets
- Laundry & utility: Laundry room; Washer; Dryer; Electric water heater
Neighborhood map
What this means for you Summary
Snapshot
- This is a 4-bed/3.5-bath single-family listed at $550k.
Deal economics
- At list price, monthly cash flow is $-35 ($-417/yr) — negative.
- To cash-flow at today's rent, offer at most $544k (1.1% below list).
- To meet the 1% rule (rent ≥ 1% of price), the offer needs to be $418k (24.1% below list).
- Recommended offer: $418k (24.1% below list) — sets the bar for 1% rule.
- Cap rate 6.2% vs local median 3.4% in Tarpon Springs — top-decile yield for the area; either an underpriced asset or a hidden risk that comps aren't pricing in. Stress-test before assuming the spread holds.
Location & tenants
- Location reads 68/100 on livability (#502 in FL) — a middle-class / working-renter tenant base. Strengths: housing A+, cost of living A, schools A-; Watch: employment C-, amenities F, commute F.
- Pinellas (suburban): math 51% / reading 51% proficiency, ranked #31 of 73 in FL (top 42%) — acceptable for families but not a draw, mixed tenant base, ~2y average lease.
- Market conditions: Rents soft (-1.2%/yr); 399 active listings in the ZIP; 4 comparable units currently listed for rent nearby; rentals at typical pace (median 17d on market — plan ~3-4 weeks tenant-placement turnaround); 2,676 units permitted in Pinellas County in 2024 (1,422 in 5+ unit buildings).
- At $4,175/mo this rent would consume 67% of the median local household income ($75k/yr) (locally 721% of renters already pay >50% of income on rent) — very limited rent-growth headroom before tenants either downsize or default.
Forward outlook
- Local home prices are declining (-3.0%/yr); year-one equity from $4k of loan paydown is wiped out by about $16k of value loss. Plan a longer hold.
- Pinellas County population projected at +14% by 2050 — modest demand growth; plan on rents tracking national, not racing it.
Negotiation context
- Only 12 days on market — expect competitive offers; lowballing is unlikely to land.
- 4 sale attempts since 22y ago with the ask held roughly flat each time — persistent listings suggest the price (not the market) is what's stuck; bring a comps-based counter.
- Current owner paid $234k; list at $550k implies a 135% gain — meaningful room to come down on a strong offer.
Risks & watch-outs
- Climate carrying-cost: moderate flood risk; severe wind risk, 99% chance of damaging wind over 30y; extreme-heat days projected 7→27/yr by 2055 (HVAC capex compounding) — expect insurance premiums to compound above CPI over the hold.
Questions for the listing agent
- What do current leases actually rent for vs. the listed asking? Can we see a recent rent roll and the last 12 months of T-12 income?
- Is there a deadline driving the sale (1031 exchange, divorce, estate, relocation)? That informs how much negotiation room exists.
- Schools are A-rated — typically a magnet for longer-tenancy family renters. What's the average tenant stay here, and is there a school-zone premium baked into asking?
- The area grade is low — what's the realistic commute time and amenity access for the typical tenant pool here? Any planned neighborhood developments (good or bad) we should know about?
- What's the average days-on-market for RENTAL listings here right now (not sales)? A rising rental-DOM trend means longer vacancies and softer asking-rent achievability than the comps imply.
- What's the recent tenant-quality profile in this submarket — average credit score on applications, eviction rate, late-payment / NSF rate, and stable-employment percentage? A property-management company in the area should have these aggregated.
- How much new for-sale + rental construction is in the pipeline within 1–3 miles? Heavy new supply typically softens prices + rents 12–24 months out; constrained supply supports both.
Investment metrics
- 1% rule
- 0.76% ✗
- Cap rate
- 6.22%
- Cash-on-cash
- -0.27%
- DSCR
- 0.99
- GRM
- 11.0
CMA / ARV
- ARV (on-the-fly)
- $612,040
- Comps found
- 12
Show comp detail 12 sales within ~0.75 mi
| Address | Dist | Beds/Ba | Sqft | Sold | Price | $/sf | Match |
|---|---|---|---|---|---|---|---|
| 1120 Lancer Ln | 0.12mi | 4/3.0 | 2,364 (+0%) | 10mo | $615,000 | $260 | 84 |
| 1113 Carlton Rd | 0.09mi | 4/3.0 | 2,537 (+8%) | 13mo | $615,000 | $242 | 70 |
| 328 Liam Ave | 0.65mi | 4/3.0 | 2,334 (-1%) | 2mo | $565,000 | $242 | 64 |
| 460 Denise St | 0.41mi | 4/2.5 | 2,157 (-8%) | 0mo | $600,000 | $278 | 63 |
| 1848 Briland St | 0.47mi | 4/2.5 | 2,134 (-9%) | 5mo | $535,000 | $251 | 54 |
| 723 Waterside Ct | 0.63mi | 4/2.5 | 2,197 (-7%) | 2mo | $730,000 | $332 | 54 |
| 1117 S Florida Ave | 0.50mi | 3/2.0 (-1) | 2,444 (+4%) | 10mo | $635,000 | $260 | 51 |
| 1072 Mainsail Dr | 0.31mi | 3/2.0 (-1) | 2,057 (-13%) | 13mo | $585,000 | $284 | 43 |
| 979 Ridgewood Ter | 0.75mi | 4/3.0 | 2,646 (+12%) | 2mo | $715,000 | $270 | 41 |
| 405 Driftwood Dr E | 0.73mi | 3/3.0 (-1) | 2,073 (-12%) | 2mo | $800,000 | $386 | 37 |
| 1222 Starboard Ky | 0.59mi | 4/3.0 | 2,007 (-15%) | 12mo | $514,000 | $256 | 36 |
| 731 Waterside Ct | 0.60mi | 3/2.0 (-1) | 2,048 (-13%) | 5mo | $487,500 | $238 | 35 |
Match score weights: distance 35% · size 25% · config 20% · recency 20%. Top-matched comps best support the ARV.
Projected returns pro-forma
-3.0% appreciation · 0.0% rent growth · sell at horizon
- IRR
- -19.8%
- Equity multiple
- 0.33×
- Total profit
- $-103,799
- Equity at exit
- $82,007
- IRR
- -19.7%
- Equity multiple
- 0.08×
- Total profit
- $-141,438
- Equity at exit
- $47,554
Cash invested: $154,000 (down + closing). Projections, not guarantees.
Landlord ↔ Tenant lean methodology
- Overall (STATE)
- 87 Strongly Landlord-Friendly
- State Florida
- 87 Strongly Landlord-Friendly · R+3
- County
- — inherits STATE
- City
- — inherits STATE
ZIP-level market 34689
- Rents YoY
- -1.2%
- Active inventory
- 399
- Price-to-rent
- 11.0×
Monthly cashflow live
- Estimated rent
- $4,175 medium interval (Pro) →
- Mortgage (P&I)
- −$2,884
- Tax from tax record
- −$220 /mo · $2,636/yr
- Insurance
- −$229
- HOA
- −$0
- Vacancy / Maint / Mgmt
- −$877
- Net cashflow
- $-35
Break-even live
UW: 25.0% down · 7.5% · 30yr · 1.5% tax · 5.0% vac · 8.0% maint · 8.0% mgmt
Financing live
Cash to close
- Down payment
- $137,500
- Closing costs
- $16,500
- Reserves months
- —
- Total cash needed
- —
Loan-product check · same deal, 3 products live
Conventional
25% down · 7.5% · 30yr
- Down + closing
- —
- Monthly P&I
- —
- Monthly cashflow
- —
- DSCR
- —
- Eligible?
- —
Personal DTI + credit; lowest rate.
DSCR
20% down · 8.5% · 30yr
- Down + closing
- —
- Monthly P&I
- —
- Monthly cashflow
- —
- DSCR
- —
- Eligible?
- —
No personal income docs; deal must DSCR.
Hard money
10% down · 12.0% · 12mo
- Down + closing
- —
- Monthly P&I
- —
- Monthly cashflow
- —
- DSCR
- —
- Eligible?
- —
Short-term bridge; refi at stabilization.
Rent comps 4 comps
| Address | Beds | Baths | Sqft | Rent | $/sqft | DOM | Units | Dist |
|---|---|---|---|---|---|---|---|---|
| 14 Mariner Dr Tarpon Springs, FL | 3.0 | 3.0 | 2800 | $3,500 | $1.25 | 24d | 1 | 0.60mi |
| 4857 Hummingbird Trl Palm Harbor, FL | 3.0 | 2.5 | 2152 | $4,000 | $1.86 | 16d | 1 | 0.75mi |
| 1417 Poinsettia Ave Unit 1244469P Tarpon Springs, FL | 4.0 | 3.0 | 2098 | $6,739 | $3.21 | 7d | 1 | 1.27mi |
| 4 W Orange St Tarpon Springs, FL | 5.0 | 3.0 | 2055 | $4,999 | $2.43 | 4d | 1 | 1.46mi |
Listing history 9 events
-
2026-06-18days on market $550,000 Active 12 DOM
-
2026-06-17days on market $550,000 Active 11 DOM
-
2026-06-16days on market $550,000 Active 10 DOM
-
2026-06-15days on market $550,000 Active 9 DOM
-
2026-06-13days on market $550,000 Active 7 DOM
-
2026-06-09days on market $550,000 Active 3 DOM
-
2026-06-08days on market $550,000 Active 2 DOM
-
2026-06-07remarks 699-char remark
-
2026-06-07$550,000 Active 1 DOM
ⓘ Source: listings_history table (triggers on properties + properties_extension) + one-shot
backfill from property_details.listing_events for pre-trigger history.
Tax reassessment forecast FL · Resets to sale price
- Current annual tax
- $2,636 · $220/mo
- Projected year-2 tax
- $4,565 · $380/mo
- Expected delta
- +$1,929/yr (+$161/mo · 73.1%)
ⓘ Screening estimate from a state-policy table — verify with the county assessor before closing.
Climate risk First Street
- Flood 5/10 Major FEMA zone X (unshaded) · 53% chance over 30 yrs
- Wildfire 2/10 Low
- Heat 10/10 Extreme 7 d/yr ≥109°F today · 27 d/yr by 30 yrs out
- Wind 10/10 Extreme 99% chance of damaging wind over 30 yrs
- Air quality 3/10 Moderate 3 unhealthy d/yr today · 3 by 30 yrs out
Nearby sold comps map
Loading sold comps map…
Walkable amenities ~0.75 mi
Loading nearby amenities…
Taxation est. · year 1
- Rental income
- $50,101
- − Mortgage interest
- −$30,809
- − Property taxes
- −$2,636
- − Insurance
- −$2,750
- − Repairs & maintenance
- −$4,008
- − Management
- −$4,008
- − Depreciation
- −$16,000
- Taxable loss
- −$10,110
- Est. tax savings @ 24.0%
- +$2,426
- After-tax cash flow
- $2,009/yr
For passive investors: Depreciation is non-cash, so a rental often shows a tax loss while cash-flowing — sheltering income. Rental losses are passive: they offset passive income freely, and up to $25,000/yr can offset ordinary (W-2) income if you actively participate and your MAGI is under $100k (phasing out to $0 by $150k); unused losses carry forward. On sale, claimed depreciation is recaptured at up to 25%, and gains may owe capital-gains tax (a 1031 exchange can defer both). Figures are a year-1 estimate at your 24.0% rate — not tax advice; consult a CPA.
Schools (NCES district)
- District
- Pinellas
- NCES district ID
- 1201560
- Math proficiency
- 51% ▼ -5.00%
- Reading proficiency
- 51% ▼ -3.00%
- Median HH income
- $46,270
- Composite
- 43.27/100
- National rank
- #3046
- State rank
- #31 of 73 in FL
Livability — Tarpon Springs
- Score
- 68/100
- State rank
- #502
- US rank
- #9244
Category grades
Schools grade is shown separately in the Schools card above.
Census & demographics
- Census place
- Tarpon Springs, FL
- County
- Pinellas County · 939,478 people
- City population
- 27,324
- Metro
- Tampa-St. Petersburg-Clearwater, FL
- Population (ZIP)
- 27,324
- Household income
- $74,854
- Rent vs Own
- Severe rent burden
- 721.0
Population outlook (Pinellas County) Hauer SSP2
- Today (2025)
- 1,027,532 people
- By 2030
- 1,063,586 · +3.5%
- By 2040
- 1,125,020 · +9.5%
- By 2050
- 1,168,637 · +13.7%
- By 2075
- 1,265,188 · +23.1%
- By 2100
- 1,260,357 · +22.7%
Race, ethnicity, and origin ACS 2023
- Neighborhood character
- Predominantly White (80%)
- Race & ethnicity
- White 80% Hispanic / Latino 10% Two or more races 7% Black 6%
- Hispanic origin (detail)
- Mexican 2% Puerto Rican 4%
- Common ancestry
- Romanian 6% Lithuanian 3% Slovak 2%
- Foreign-born
- 10% · Canada, Jamaica, Dominican Republic
- Languages at home
- 84% English-only · Other Indo-European 6% Spanish 6% French/Haitian/Cajun 1%
Political lean MEDSL · Pinellas
- 2024 margin
- Lean R (+5.2) · D 46.9% · R 52.1%
- 2008→2024 swing
- -13.5pp toward R · 2008: 8.3pp · 2024: -5.2pp
- All cycles
- 2024: R+5.2 2020: D+0.2 2016: R+1.1 2012: D+5.6 2008: D+8.3
Not yet ingested
- Civics
- —
Market trends
- HPI YoY
- ▼ -300.96%
- Current HPI
- 303.7434
- Rent YoY
- ▼ -1.16%
- Metro
- Tampa-St. Petersburg-Clearwater, FL
- State GDP YoY
- ▲ 3.28%
- F500 in state
- 36
Industry mix (Fortune 500 HQ in FL)
| Industry | F500 HQs | Revenue |
|---|---|---|
| Industrial Technology | 2 | $29B |
|
||
| Insurance | 2 | $17B |
|
||
| Retail | 1 | $60B |
|
||
| Technology Distribution | 1 | $58B |
|
||
| Homebuilding | 1 | $35B |
|
||
| Technology Manufacturing | 1 | $35B |
|
||
Price history
+175.1% since first listed11 events — show timeline
- 2026-06-06 Listed $550,000 Stellar MLS as Distributed by MLS Grid
- 2008-11-20 Sold (Public Records) $234,000 Public Records
- 2008-11-13 Sold (MLS) $234,000 Stellar MLS as Distributed by MLS Grid
- 2008-04-23 Listed $260,000 Stellar MLS as Distributed by MLS Grid
- 2007-07-20 Listing Removed — Stellar MLS as Distributed by MLS Grid
- 2007-04-23 Listed $440,000 Stellar MLS as Distributed by MLS Grid
- 2004-08-03 Sold (Public Records) $280,000 Public Records
- 2004-08-01 Sold (MLS) $294,900 Stellar MLS as Distributed by MLS Grid
- 2004-06-10 Listing Removed — Stellar MLS as Distributed by MLS Grid
- 2004-04-28 Listed $294,900 Stellar MLS as Distributed by MLS Grid
- 2001-02-16 Sold (Public Records) $199,900 Public Records
Property tax history
-3.6%/yrLatest (2025): $2,636 · +6.1% YoY. Source: county tax records.
Cash-flow waterfall
monthlySold comps — $/sqft
last 12 mo · ≤1 miLoading sold comps…