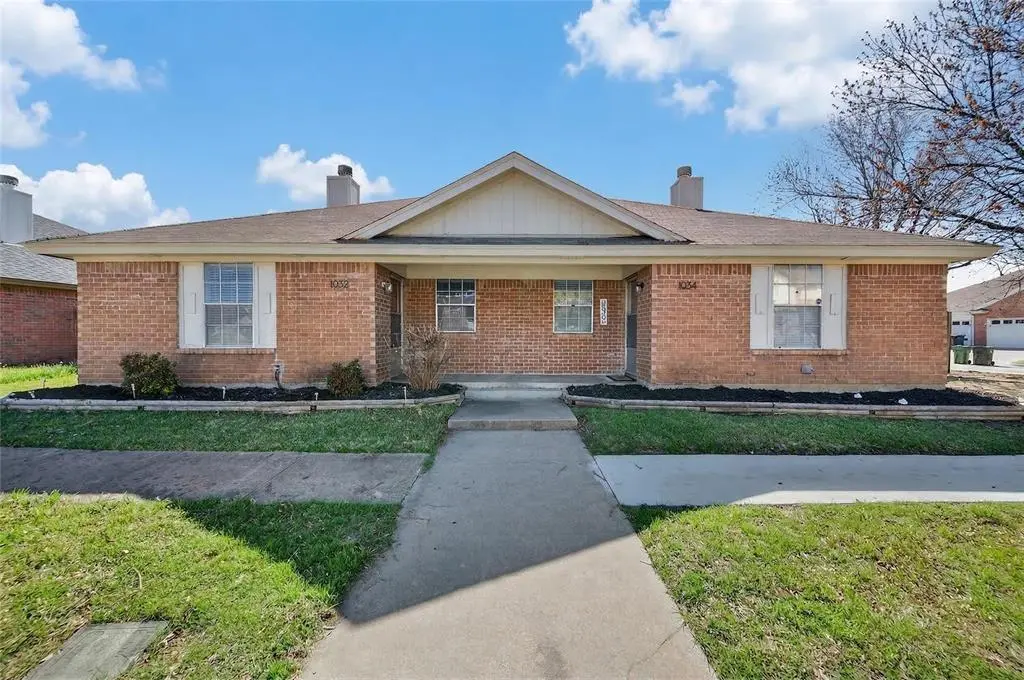
1034 Tennessee Trl
Arlington, TX 76017
$200,000C-
2 bd · 2.0 ba ·
1,077 sqft ·
Built 1986
· Townhouse
· Pending
· 43 DOM
Cashflow @ list (25.0% down · 7.5%)
Estimated rent
$1,889/mo
Mortgage (P&I)
−$1,049
Tax + insurance
−$363
HOA
−$0
Vac / Maint / Mgmt
−$397
Net cashflow
$80/mo
Annual
$962/yr
Cap rate
6.77%
Cash-on-cash
1.72%
DSCR
1.08
1% rule
0.94%
Cash to close
$56,000
Investor read
- This is a 2-bed/2.0-bath townhouse listed at $200k.
- At list price, monthly cash flow is $80 ($962/yr) — positive.
- The deal already cash-flows at list — no discount required.
- To meet the 1% rule (rent ≥ 1% of price), the offer needs to be $189k (5.5% below list).
- It's been on market 43 days — a 3% lower offer ($194k) is reasonable based on typical stale-listing flexibility.
- Recommended offer: $189k (5.5% below list) — sets the bar for 1% rule.
- Local home prices are declining (-3.0%/yr); year-one equity from $1k of loan paydown is wiped out by about $6k of value loss. Plan a longer hold.
- Location reads 78/100 on livability (#75 in TX, #2,697 nationally) — a middle-class / working-renter tenant base. Strengths: amenities A+, cost of living A+, housing A+; Watch: crime F, commute F.
- Mansfield ISD (suburban): math 47% / reading 53% proficiency, ranked #125 of 826 in TX (top 15%) — acceptable for families but not a draw, mixed tenant base, ~2y average lease.
- Zoned schools: Glenn Harmon El (math 17% / reading 22%, grade F, #3,583 of 4,322 statewide, top 86%, 430 students, 87% FRL); T A Howard Middle (math 30% / reading 43%, grade F, #786 of 1,662 statewide, top 48%, 687 students, 76% FRL); Mansfield Summit H S (math 44% / reading 48%, grade D-, #627 of 1,632 statewide, top 38%, 1,856 students, 69% FRL) — zoned schools average 77% FRL vs 35% district-wide (42 pts higher); higher-poverty schools than district average — tighter screening recommended.
- Zoned-school proficiency averages 34% at this address vs 50% district-wide (-16 pts) — the specific schools serving this property underperform the Mansfield ISD average; the district grade overstates school quality for this exact location.
- Market conditions: Rents soft (-0.8%/yr); 201 active listings in the ZIP; 40 comparable units currently listed for rent nearby; rentals at typical pace (median 26d on market — plan ~3-4 weeks tenant-placement turnaround); solid renter incomes; 18,938 units permitted in Tarrant County in 2024 (8,336 in 5+ unit buildings).
- Tarrant County population projected at +41% by 2050 — long-run rental-demand tailwind backs the buy-and-hold thesis.
- 2 sale attempts with the ask held roughly flat each time — persistent listings suggest the price (not the market) is what's stuck; bring a comps-based counter.
- Climate carrying-cost: moderate wind risk, 26% chance of damaging wind over 30y; extreme-heat days projected 7→23/yr by 2055 (HVAC capex compounding) — expect insurance premiums to compound above CPI over the hold.
- Cap rate 6.8% vs local median 3.6% in Arlington — top-decile yield for the area; either an underpriced asset or a hidden risk that comps aren't pricing in. Stress-test before assuming the spread holds.
Questions for listing agent
- It's been on market 43 days. Have you received any prior offers? Is the seller open to a 6% concession, seller financing, or rate buy-down credit?
- Is there a deadline driving the sale (1031 exchange, divorce, estate, relocation)? That informs how much negotiation room exists.
- Schools are D-rated, which usually means shorter tenancies and higher turnover. Who's the typical renter profile here, and what's been the actual vacancy rate?
- Crime grade is F in this area — have there been break-ins, vandalism, or insurance claims at this property in the last 3 years? What carrier currently insures it and at what premium?
- What's the average days-on-market for RENTAL listings here right now (not sales)? A rising rental-DOM trend means longer vacancies and softer asking-rent achievability than the comps imply.
- What's the recent tenant-quality profile in this submarket — average credit score on applications, eviction rate, late-payment / NSF rate, and stable-employment percentage? A property-management company in the area should have these aggregated.
- How much new for-sale + rental construction is in the pipeline within 1–3 miles? Heavy new supply typically softens prices + rents 12–24 months out; constrained supply supports both.
CashFlowRE · CFR-08T335BDPRTBQJ
· Data 3 weeks ago
cashflowre.app · 2026-05-29