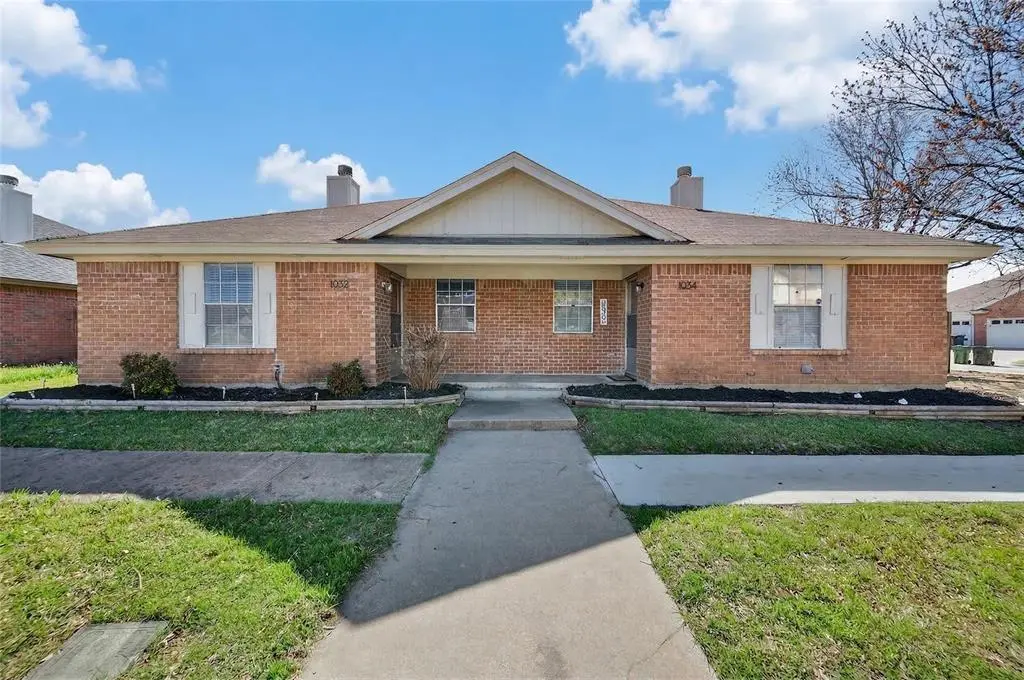
1034 Tennessee Trl · Arlington, TX
Flood risk 1/10 · Minimal
- FEMA flood zone
- X (unshaded)
- Chance of flooding over 30 yrs
- 0.0%
- Est. flood insurance / yr
- $507 – $1,088
Fire risk 4/10 · Minor
- Est. fire insurance / yr
- $1,222 – $2,270
Heat risk 7/10 · Major
- Hot days now (above 110°F)
- 7 days/yr
- Hot days in 30 yrs
- 23 days/yr
Wind risk 5/10 · Moderate
- Chance of severe wind over 30 yrs
- 26.0%
Air-quality risk 3/10 · Minor
- Unhealthy air days now
- 2 days/yr
- Unhealthy air days in 30 yrs
- 3 days/yr
Risk factors via First Street. Map © Google.
Why this score? — see what drove the C- grade
The composite is a weighted blend of 9 inputs, each scored 0–100. Each bar is that input's sub-score; the figure is the points it added to the 100-point composite (weight × sub-score).
- Cash flow +15.5/30.0
- ARV discount +13.5/15.0
- DSCR +4.8/10.0
- Schools +4.6/10.0
- 1% rule +4.4/10.0
- Livability +3.9/5.0
- Condition / age +2.5/5.0
- Rent growth +2.3/5.0
- Appreciation +0.0/10.0
$200,000
🖨 Deal sheet (PDF) 📄 Offer letter ✓ Due diligence
Listing remarks
Corner-lot opportunity in south Arlington with flexibility for an owner-occupant or rental hold. Located in The Crest, 1034 Tennessee Trail is a 2-bedroom, 2-bath half duplex with 1,077 square feet, a smart single-story layout, & updates that make it easy to move right in. The location puts you close to everyday shopping, dining, & neighborhood conveniences while still offering a comfortable residential setting in Arlington. The home is also served by Mansfield ISD, a major plus for buyers looking for location and school district value. Inside, the living room has great character with a bold blue accent wall, LVP flooring, a wood-burning brick fireplace, and a ceiling fan that hel
Key facts
- 5,184 sq ft lot
- 2 parking spots
- Built 1986
Tags
Property features AI
Finance
- Other: Survey available; Listing accepts Cash, Conventional, FHA, and VA financing
- HOA & community: No association
Exterior
- Parking: Detached carport; Covered parking (2 spaces); 2 carport spaces
- Utilities: City water; City sewer; Electricity connected; Cable available
- Home design: Single family residence; Attached property; One story
- Construction: Brick construction; Composition roof; Slab foundation; Built in 1986
- Exterior features: Front porch; Back yard fencing; Fenced lot; Corner lot; Few trees; Subdivision setting; Easements for utilities
Interior
- Kitchen: Dishwasher; Electric cooktop; Electric oven; Electric range; Refrigerator; Built-in cabinets
- Bedrooms: Primary bedroom on main level with ensuite bath; Second bedroom on main level
- Flooring: Carpet; Ceramic tile; Luxury vinyl plank
- Bathrooms: 2 full bathrooms
- Heating & cooling: Central heating (electric); Central air (electric); Ceiling fans
- Interior features: Open floorplan; Paneling; Cable TV available; High speed internet available; Window coverings; 1 living area; 1 dining area; Room count of 8; One-level layout
- Laundry & utility: Separate utility room; Full-size washer/dryer area; Washer hookup
Neighborhood map
What this means for you Summary
Snapshot
- This is a 2-bed/2.0-bath townhouse listed at $200k.
Deal economics
- At list price, monthly cash flow is $80 ($962/yr) — positive.
- The deal already cash-flows at list — no discount required.
- To meet the 1% rule (rent ≥ 1% of price), the offer needs to be $189k (5.5% below list).
- Recommended offer: $189k (5.5% below list) — sets the bar for 1% rule.
- Cap rate 6.8% vs local median 3.6% in Arlington — top-decile yield for the area; either an underpriced asset or a hidden risk that comps aren't pricing in. Stress-test before assuming the spread holds.
Location & tenants
- Location reads 78/100 on livability (#75 in TX, #2,697 nationally) — a middle-class / working-renter tenant base. Strengths: amenities A+, cost of living A+, housing A+; Watch: crime F, commute F.
- Mansfield ISD (suburban): math 47% / reading 53% proficiency, ranked #125 of 826 in TX (top 15%) — acceptable for families but not a draw, mixed tenant base, ~2y average lease.
- Zoned schools: Glenn Harmon El (math 17% / reading 22%, grade F, #3,583 of 4,322 statewide, top 86%, 430 students, 87% FRL); T A Howard Middle (math 30% / reading 43%, grade F, #786 of 1,662 statewide, top 48%, 687 students, 76% FRL); Mansfield Summit H S (math 44% / reading 48%, grade D-, #627 of 1,632 statewide, top 38%, 1,856 students, 69% FRL) — zoned schools average 77% FRL vs 35% district-wide (42 pts higher); higher-poverty schools than district average — tighter screening recommended.
- Zoned-school proficiency averages 34% at this address vs 50% district-wide (-16 pts) — the specific schools serving this property underperform the Mansfield ISD average; the district grade overstates school quality for this exact location.
- Market conditions: Rents soft (-0.8%/yr); 201 active listings in the ZIP; 40 comparable units currently listed for rent nearby; rentals at typical pace (median 26d on market — plan ~3-4 weeks tenant-placement turnaround); solid renter incomes; 18,938 units permitted in Tarrant County in 2024 (8,336 in 5+ unit buildings).
Forward outlook
- Local home prices are declining (-3.0%/yr); year-one equity from $1k of loan paydown is wiped out by about $6k of value loss. Plan a longer hold.
- Tarrant County population projected at +41% by 2050 — long-run rental-demand tailwind backs the buy-and-hold thesis.
Negotiation context
- It's been on market 43 days — a 3% lower offer ($194k) is reasonable based on typical stale-listing flexibility.
- 2 sale attempts with the ask held roughly flat each time — persistent listings suggest the price (not the market) is what's stuck; bring a comps-based counter.
Risks & watch-outs
- Climate carrying-cost: moderate wind risk, 26% chance of damaging wind over 30y; extreme-heat days projected 7→23/yr by 2055 (HVAC capex compounding) — expect insurance premiums to compound above CPI over the hold.
Questions for the listing agent
- It's been on market 43 days. Have you received any prior offers? Is the seller open to a 6% concession, seller financing, or rate buy-down credit?
- Is there a deadline driving the sale (1031 exchange, divorce, estate, relocation)? That informs how much negotiation room exists.
- Schools are D-rated, which usually means shorter tenancies and higher turnover. Who's the typical renter profile here, and what's been the actual vacancy rate?
- Crime grade is F in this area — have there been break-ins, vandalism, or insurance claims at this property in the last 3 years? What carrier currently insures it and at what premium?
- What's the average days-on-market for RENTAL listings here right now (not sales)? A rising rental-DOM trend means longer vacancies and softer asking-rent achievability than the comps imply.
- What's the recent tenant-quality profile in this submarket — average credit score on applications, eviction rate, late-payment / NSF rate, and stable-employment percentage? A property-management company in the area should have these aggregated.
- How much new for-sale + rental construction is in the pipeline within 1–3 miles? Heavy new supply typically softens prices + rents 12–24 months out; constrained supply supports both.
Investment metrics
- 1% rule
- 0.94% ✗
- Cap rate
- 6.77%
- Cash-on-cash
- 1.72%
- DSCR
- 1.08
- GRM
- 8.8
CMA / ARV
- ARV (on-the-fly)
- $230,478
- Comps found
- 4
Show comp detail 4 sales within ~0.75 mi
| Address | Dist | Beds/Ba | Sqft | Sold | Price | $/sf | Match |
|---|---|---|---|---|---|---|---|
| 5925 Timbercrest Dr | 0.05mi | 2/2.0 | 1,180 (+10%) | 9mo | $200,000 | $169 | 74 |
| 5900 Baroncrest Dr | 0.20mi | 2/2.0 | 1,180 (+10%) | 20mo | $225,000 | $191 | 58 |
| 831 Valleybrooke Dr | 0.72mi | 2/2.0 | 1,053 (-2%) | 15mo | $225,000 | $214 | 50 |
| 6420 Brookhaven Trl | 0.69mi | 2/2.0 | 919 (-15%) | 21mo | $215,000 | $234 | 26 |
Match score weights: distance 35% · size 25% · config 20% · recency 20%. Top-matched comps best support the ARV.
Projected returns pro-forma
-3.0% appreciation · 0.0% rent growth · sell at horizon
- IRR
- -17.0%
- Equity multiple
- 0.41×
- Total profit
- $-32,791
- Equity at exit
- $29,821
- IRR
- -16.0%
- Equity multiple
- 0.23×
- Total profit
- $-43,181
- Equity at exit
- $17,292
Cash invested: $56,000 (down + closing). Projections, not guarantees.
Landlord ↔ Tenant lean methodology
- Overall (STATE)
- 87 Strongly Landlord-Friendly
- State Texas
- 87 Strongly Landlord-Friendly · R+5
- County
- — inherits STATE
- City
- — inherits STATE
ZIP-level market 76017
- Rents YoY
- -0.8%
- Active inventory
- 201
- Price-to-rent
- 8.8×
Monthly cashflow live
- Estimated rent
- $1,889 high interval (Pro) →
- Mortgage (P&I)
- −$1,049
- Tax from tax record
- −$280 /mo · $3,360/yr
- Insurance
- −$83
- HOA
- −$0
- Vacancy / Maint / Mgmt
- −$397
- Net cashflow
- $80
Break-even live
Sensitivity live
| Price | -10% $193 | -5% $137 | +0% $80 | +5% $24 | +10% $-33 |
|---|---|---|---|---|---|
| Rent | -10% $-69 | -5% $6 | +0% $80 | +5% $155 | +10% $229 |
| Rate | -1.0pp $181 | -0.5pp $131 | base $80 | +0.5pp $28 | +1.0pp $-24 |
UW: 25.0% down · 7.5% · 30yr · 1.5% tax · 5.0% vac · 8.0% maint · 8.0% mgmt
Financing live
Cash to close
- Down payment
- $50,000
- Closing costs
- $6,000
- Reserves months
- —
- Total cash needed
- —
Loan-product check · same deal, 3 products live
Conventional
25% down · 7.5% · 30yr
- Down + closing
- —
- Monthly P&I
- —
- Monthly cashflow
- —
- DSCR
- —
- Eligible?
- —
Personal DTI + credit; lowest rate.
DSCR
20% down · 8.5% · 30yr
- Down + closing
- —
- Monthly P&I
- —
- Monthly cashflow
- —
- DSCR
- —
- Eligible?
- —
No personal income docs; deal must DSCR.
Hard money
10% down · 12.0% · 12mo
- Down + closing
- —
- Monthly P&I
- —
- Monthly cashflow
- —
- DSCR
- —
- Eligible?
- —
Short-term bridge; refi at stabilization.
Rent comps 40 comps
| Address | Beds | Baths | Sqft | Rent | $/sqft | DOM | Units | Dist |
|---|---|---|---|---|---|---|---|---|
| 1009 Danforth Ct Arlington, TX | 3.0 | 2.0 | 1436 | $2,050 | $1.43 | 4d | 1 | 0.12mi |
| 911 Pinion Dr Arlington, TX | 3.0 | 2.0 | 1299 | $1,400 | $1.08 | 45d | 1 | 0.23mi |
| 5907 Valleycreek Ln Arlington, TX | 2.0 | 2.0 | 976 | $1,450 | $1.49 | 45d | 1 | 0.34mi |
| 5901 Valleycreek Ln Arlington, TX | 1.0–2.0 | 1.0–2.0 | 838 | $1,764 | $2.11 | 0d | 28 | 0.34mi |
| 916 Ashmount Ln Arlington, TX | 3.0 | 2.0 | 1185 | $1,899 | $1.60 | 45d | 1 | 0.38mi |
| 920 Tennessee Trl Arlington, TX | 3.0 | 2.0 | 1500 | $2,095 | $1.40 | 3d | 1 | 0.39mi |
| 6216 Fairlane Dr Arlington, TX | 3.0 | 2.0 | 1270 | $1,966 | $1.55 | 23d | 1 | 0.45mi |
| 6216 Fairlane Dr Arlington, TX | 3.0 | 2.0 | 1270 | $1,900 | $1.50 | 14d | 1 | 0.45mi |
| 6301 Fairlane Dr Arlington, TX | 3.0 | 2.0 | 1420 | $1,900 | $1.34 | 26d | 1 | 0.47mi |
| 5821 Mansfield Rd Arlington, TX | 2.0 | 1.0 | 917 | $1,400 | $1.53 | 23d | 1 | 0.52mi |
| 5821 Mansfield Rd Arlington, TX | 2.0 | 1.5 | 917 | $1,400 | $1.53 | 26d | 1 | 0.52mi |
| 6406 Mercedes Dr Arlington, TX | 3.0 | 2.0 | 1495 | $2,395 | $1.60 | 45d | 1 | 0.53mi |
| 5501 White Dove Dr Arlington, TX | 3.0 | 2.0 | 1455 | $1,950 | $1.34 | 26d | 1 | 0.57mi |
| 6014 Hollyleaf Dr Arlington, TX | 3.0 | 2.5 | 1389 | $2,145 | $1.54 | 3d | 1 | 0.59mi |
| 914 Pierce Arrow Dr Arlington, TX | 3.0 | 2.0 | 1301 | $2,000 | $1.54 | 45d | 1 | 0.59mi |
| 6501 Topaz Dr Arlington, TX | 3.0 | 2.0 | 1130 | $1,995 | $1.77 | 26d | 1 | 0.64mi |
| 863 Valleybrooke Dr Arlington, TX | 3.0 | 2.0 | 1123 | $1,950 | $1.74 | 45d | 1 | 0.65mi |
| 5907 Lovingham Ct Unit 5907 Arlington, TX | 3.0 | 2.0 | 1200 | $2,050 | $1.71 | 45d | 1 | 0.67mi |
| 816 W Colony Dr Arlington, TX | 3.0 | 2.0 | 1296 | $2,025 | $1.56 | 20d | 1 | 0.69mi |
| 2127 Chapel Downs Dr Arlington, TX | 3.0 | 2.0 | 1480 | $1,115 | $0.75 | 26d | 1 | 0.71mi |
| 746 Bonnet Trl Arlington, TX | 2.0 | 2.0 | 1416 | $2,175 | $1.54 | 26d | 1 | 0.75mi |
| 1802 Wimbledon Oaks Ln Arlington, TX | 1.0–2.0 | 1.0–2.0 | 870 | $1,795 | $2.06 | 0d | 23 | 0.77mi |
| 5234 Villa Del Mar Ave Arlington, TX | 1.0 | 1.0 | 764 | $1,390 | $1.82 | 45d | 1 | 0.77mi |
| 1003 Prado Real Dr Arlington, TX | 3.0 | 2.0 | 1446 | $2,346 | $1.62 | 1d | 1 | 0.84mi |
| 805 Greenridge Dr Arlington, TX | 3.0 | 2.0 | 1361 | $2,050 | $1.51 | 21d | 1 | 0.85mi |
| 101 Colony Dr Arlington, TX | 3.0 | 2.0 | 1400 | $2,055 | $1.47 | 45d | 1 | 0.89mi |
| 216 Caprock Dr Arlington, TX | 3.0 | 2.0 | 1211 | $1,850 | $1.53 | 5d | 1 | 0.90mi |
| 216 Caprock Dr Arlington, TX | 3.0 | 2.0 | 1211 | $1,850 | $1.53 | 18d | 1 | 0.90mi |
| 1224 Deuce Dr Arlington, TX | 1.0–2.0 | 1.0–2.0 | 743 | $1,475 | $1.98 | 26d | 3 | 0.99mi |
| 5210 Livermore Dr Arlington, TX | 3.0 | 2.0 | 1388 | $2,164 | $1.56 | 26d | 1 | 1.02mi |
| 5216 Carpenter Dr Arlington, TX | 3.0 | 2.5 | 1276 | $1,925 | $1.51 | 20d | 1 | 1.03mi |
| 5211 Carpenter Dr Arlington, TX | 3.0 | 2.0 | 1268 | $1,945 | $1.53 | 19d | 1 | 1.06mi |
| 5211 Carpenter Dr Arlington, TX | 3.0 | 2.0 | 1268 | $1,945 | $1.53 | 26d | 1 | 1.06mi |
| 323 Moss Hill Dr Arlington, TX | 3.0 | 2.0 | 1053 | $1,900 | $1.80 | 9d | 1 | 1.06mi |
| 325 Angelina Dr Arlington, TX | 3.0 | 2.0 | 1441 | $1,900 | $1.32 | 9d | 1 | 1.07mi |
| 6306 Pilgrim Ln Arlington, TX | 3.0 | 2.0 | 1197 | $1,885 | $1.57 | 45d | 1 | 1.12mi |
| 6707 Country Creek Dr Arlington, TX | 3.0 | 2.0 | 1106 | $1,995 | $1.80 | 7d | 1 | 1.14mi |
| 222 Mahogany Dr Arlington, TX | 3.0 | 2.0 | 1421 | $2,160 | $1.52 | 18d | 1 | 1.15mi |
| 820 Lawndale Dr Arlington, TX | 3.0 | 2.0 | 1249 | $1,995 | $1.60 | 45d | 1 | 1.17mi |
| 5310 Pampas Ct Arlington, TX | 3.0 | 2.0 | 1231 | $1,800 | $1.46 | 26d | 1 | 1.19mi |
Listing history 6 events
-
2026-05-02status Pending
-
2026-04-27historical Active Option Contract
-
2026-04-23price $200,000
-
2026-04-07status Active
-
2026-04-02historical Active Option Contract
-
2026-03-20$205,000 Active
ⓘ Source: listings_history table (triggers on properties + properties_extension) + one-shot
backfill from property_details.listing_events for pre-trigger history.
Tax reassessment forecast TX · Resets to sale price
- Current annual tax
- $3,360 · $280/mo
- Projected year-2 tax
- $3,660 · $305/mo
- Expected delta
- +$300/yr (+$25/mo · 8.9%)
ⓘ Screening estimate from a state-policy table — verify with the county assessor before closing.
Climate risk First Street
- Flood 1/10 Low FEMA zone X (unshaded) · 0% chance over 30 yrs
- Wildfire 4/10 Moderate
- Heat 7/10 Severe 7 d/yr ≥110°F today · 23 d/yr by 30 yrs out
- Wind 5/10 Major 26% chance of damaging wind over 30 yrs
- Air quality 3/10 Moderate 2 unhealthy d/yr today · 3 by 30 yrs out
Nearby sold comps map
Loading sold comps map…
Walkable amenities ~0.75 mi
Loading nearby amenities…
Taxation est. · year 1
- Rental income
- $22,669
- − Mortgage interest
- −$11,203
- − Property taxes
- −$3,360
- − Insurance
- −$1,000
- − Repairs & maintenance
- −$1,814
- − Management
- −$1,814
- − Depreciation
- −$5,818
- Taxable loss
- −$2,340
- Est. tax savings @ 24.0%
- +$562
- After-tax cash flow
- $1,524/yr
For passive investors: Depreciation is non-cash, so a rental often shows a tax loss while cash-flowing — sheltering income. Rental losses are passive: they offset passive income freely, and up to $25,000/yr can offset ordinary (W-2) income if you actively participate and your MAGI is under $100k (phasing out to $0 by $150k); unused losses carry forward. On sale, claimed depreciation is recaptured at up to 25%, and gains may owe capital-gains tax (a 1031 exchange can defer both). Figures are a year-1 estimate at your 24.0% rate — not tax advice; consult a CPA.
Schools (NCES district)
- District
- Mansfield ISD
- NCES district ID
- 4828920
- Math proficiency
- 47% ▼ -17.00%
- Reading proficiency
- 53% ▼ -6.00%
- Median HH income
- $81,934
- Composite
- 45.82/100
- National rank
- #2558
- State rank
- #125 of 826 in TX
Livability — Arlington
- Score
- 78/100
- State rank
- #75
- US rank
- #2697
Category grades
Schools grade is shown separately in the Schools card above.
Census & demographics
- Census place
- Arlington, TX
- County
- Tarrant County · 2,033,669 people
- City population
- 366,588
- Metro
- Dallas-Fort Worth-Arlington, TX
- Population (ZIP)
- 47,074
- Household income
- $90,083
- Rent vs Own
- Severe rent burden
- 1311.0
Population outlook (Tarrant County) Hauer SSP2
- Today (2025)
- 2,380,417 people
- By 2030
- 2,578,900 · +8.3%
- By 2040
- 2,974,995 · +25.0%
- By 2050
- 3,350,489 · +40.8%
- By 2075
- 4,216,909 · +77.2%
- By 2100
- 4,741,527 · +99.2%
Race, ethnicity, and origin ACS 2023
- Neighborhood character
- Diverse neighborhood (Simpson 0.68)
- Race & ethnicity
- White 48% Black 21% Hispanic / Latino 20% Two or more races 11% Asian 6%
- Hispanic origin (detail)
- Mexican 15% Puerto Rican 2%
- Common ancestry
- Italian 2% Slovak 2% Romanian 1%
- Foreign-born
- 13% · Canada, Vietnam, China
- Languages at home
- 78% English-only · Spanish 12% Vietnamese 2% Other Indo-European 2%
Political lean MEDSL · Tarrant
- 2024 margin
- Lean R (+5.1) · D 46.7% · R 51.9% · Other 1.4%
- 2008→2024 swing
- +6.6pp toward D · 2008: -11.7pp · 2024: -5.1pp
- All cycles
- 2024: R+5.1 2020: D+0.2 2016: R+8.7 2012: R+15.7 2008: R+11.7
Not yet ingested
- Civics
- —
Market trends
- HPI YoY
- ▼ -184.11%
- Current HPI
- 268.3139
- Rent YoY
- ▼ -0.80%
- Metro
- Dallas-Fort Worth-Arlington, TX
- State GDP YoY
- ▲ 3.95%
- F500 in state
- 110
Industry mix (Fortune 500 HQ in TX)
| Industry | F500 HQs | Revenue |
|---|---|---|
| Energy | 16 | $1,198B |
|
||
| Technology | 5 | $198B |
|
||
| Engineering / Construction | 4 | $72B |
|
||
| Energy Services | 3 | $60B |
|
||
| Utilities | 3 | $41B |
|
||
| Healthcare | 2 | $330B |
|
||
Price history
-2.4% since first listed6 events — show timeline
- 2026-05-02 Pending — NTREIS
- 2026-04-27 Contingent — NTREIS
- 2026-04-23 Price Changed $200,000 NTREIS
- 2026-04-07 Relisted — NTREIS
- 2026-04-02 Contingent — NTREIS
- 2026-03-20 Listed $205,000 NTREIS
Property tax history
+4.5%/yrLatest (2025): $3,360 · +0.5% YoY. Source: county tax records.
Cash-flow waterfall
monthlySold comps — $/sqft
last 12 mo · ≤1 miLoading sold comps…