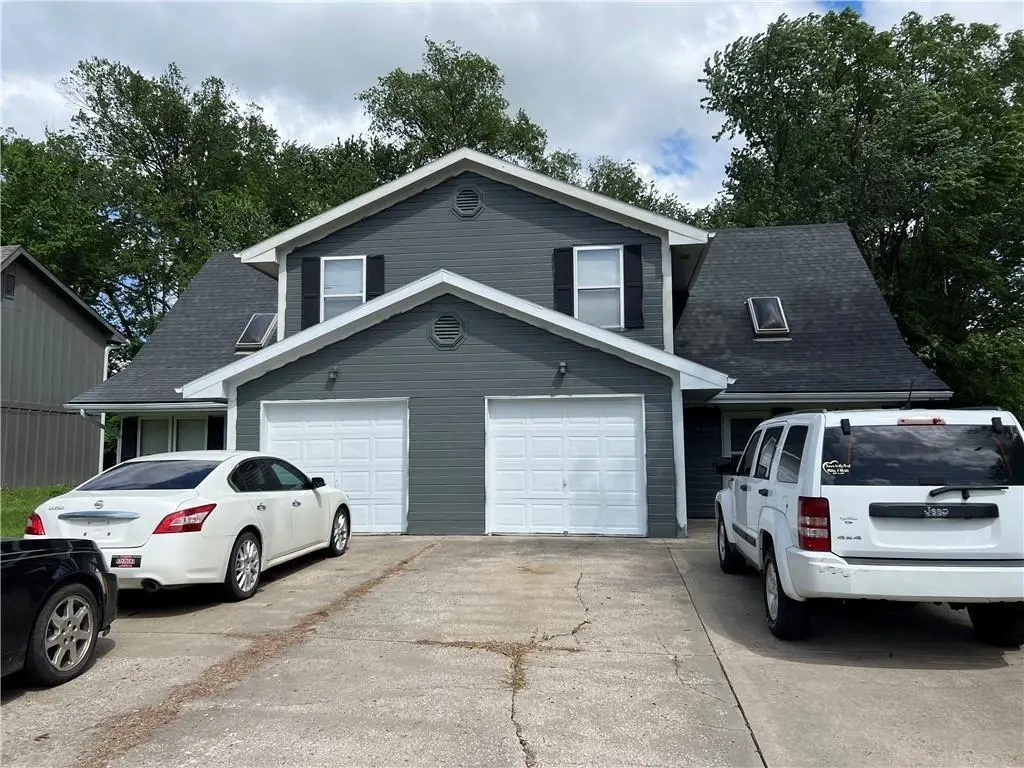
411-413 Spring Ave
Liberty, MO 64068
$369,900C-
3 bd · 2.0 ba ·
2,616 sqft ·
Built 1988
· MultiFamily
· Active
· 51 DOM
Cashflow @ list (25.0% down · 7.5%)
Estimated rent
$3,201/mo
Mortgage (P&I)
−$1,940
Tax + insurance
−$455
HOA
−$0
Vac / Maint / Mgmt
−$672
Net cashflow
$134/mo
Annual
$1,608/yr
Cap rate
6.73%
Cash-on-cash
1.55%
DSCR
1.07
1% rule
0.87%
Cash to close
$103,572
Investor read
- This is a 2 × 3-bed/1.5-bath units multifamily listed at $370k.
- At list price, monthly cash flow is $134 ($2k/yr) — positive. Per door: $67/mo.
- The deal already cash-flows at list — no discount required.
- To meet the 1% rule (rent ≥ 1% of price), the offer needs to be $320k (13.5% below list).
- It's been on market 51 days — a 3% lower offer ($359k) is reasonable based on typical stale-listing flexibility.
- Recommended offer: $320k (13.5% below list) — sets the bar for 1% rule.
- Local home prices are declining (-3.0%/yr); year-one equity from $3k of loan paydown is wiped out by about $11k of value loss. Plan a longer hold.
- Location reads 81/100 on livability (#15 in MO, #1,487 nationally) — a professional / high-income tenant draw. Strengths: employment A+, cost of living A+, housing A+; Watch: commute F.
- Liberty 53 (suburban): math 41% / reading 59% proficiency, ranked #24 of 324 in MO (top 7%) — acceptable for families but not a draw, mixed tenant base, ~2y average lease; only 15% free/reduced lunch — higher-income household profile.
- Zoned schools: Lillian Schumacher Elem. (math 39% / reading 49%, grade F, #469 of 1,115 statewide, top 42%, 475 students, 34% FRL); Liberty Middle School (math 34% / reading 51%, grade D-, #140 of 391 statewide, top 38%, 638 students, 33% FRL); Liberty High (math 33% / reading 75%, grade C-, #82 of 521 statewide, top 16%, 1,997 students, 22% FRL).
- Market conditions: Rents rising fast (+4.7%/yr); 187 active listings in the ZIP; 1 comparable units currently listed for rent nearby; solid renter incomes; 341 units permitted in Clay County in 2024 (40 in 5+ unit buildings).
- Clay County population projected at +24% by 2050 — long-run rental-demand tailwind backs the buy-and-hold thesis.
- 3 sale attempts since 13y ago; this cycle's ask has dropped $25k (6%) from the opening price — seller is motivated, your offer sets the floor, not the list.
- Cap rate 6.7% vs local median 2.6% in Liberty — top-decile yield for the area; either an underpriced asset or a hidden risk that comps aren't pricing in. Stress-test before assuming the spread holds.
- This rent runs 42% of the median local income ($92k/yr) — at the standard rent-burdened threshold; future hikes will face affordability resistance.
Questions for listing agent
- It's been on market 51 days. Have you received any prior offers? Is the seller open to a 13% concession, seller financing, or rate buy-down credit?
- Can we see the unit-by-unit rent roll, current vacancy, and any below-market leases? What's the average tenancy length?
- What capital expenditures (roof, boiler, parking lot, exteriors) have been made in the last 5 years, and what's planned in the next 2?
- Is there a deadline driving the sale (1031 exchange, divorce, estate, relocation)? That informs how much negotiation room exists.
- Schools are B-rated — typically a magnet for longer-tenancy family renters. What's the average tenant stay here, and is there a school-zone premium baked into asking?
- What's the average days-on-market for RENTAL listings here right now (not sales)? A rising rental-DOM trend means longer vacancies and softer asking-rent achievability than the comps imply.
- What's the recent tenant-quality profile in this submarket — average credit score on applications, eviction rate, late-payment / NSF rate, and stable-employment percentage? A property-management company in the area should have these aggregated.
- How much new apartment / multifamily construction is in the pipeline within 1–3 miles? Heavy new supply (>2% of stock underway) typically softens rents 12–24 months out; light construction supports rent growth.
CashFlowRE · CFR-0A4GQZCJ1Y9WK0
· Data 1 day ago
cashflowre.app · 2026-05-29