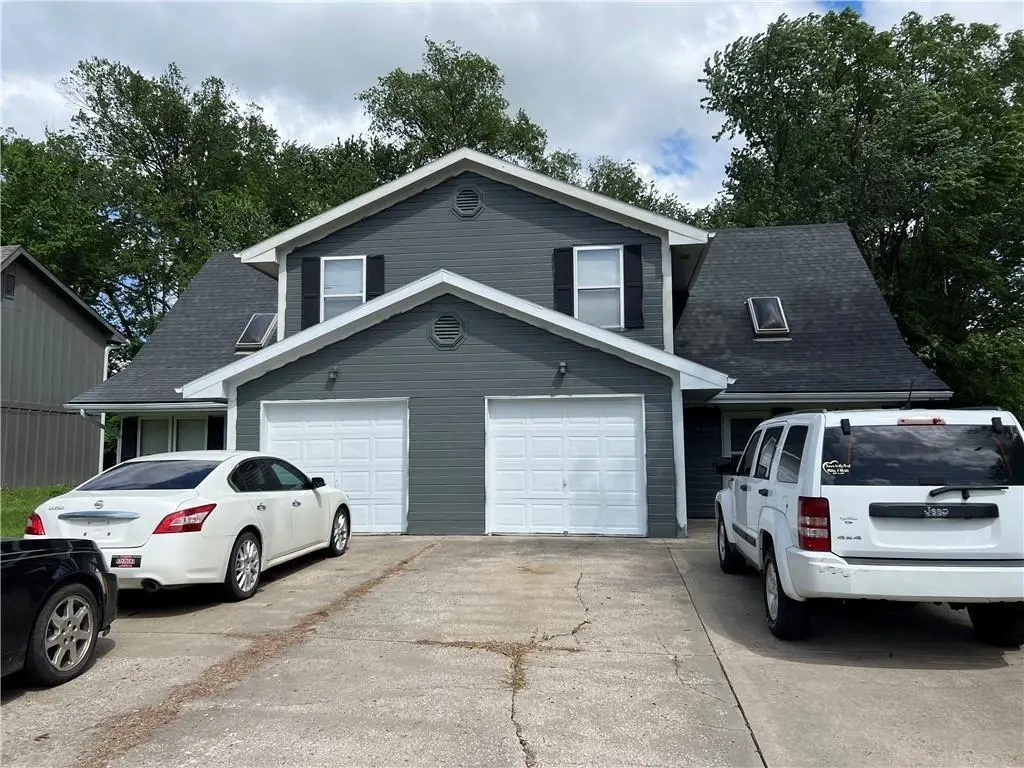
 Duplex
411-413 Spring Ave · Liberty, MO
Flood risk 1/10 · Minimal
- FEMA flood zone
- X (unshaded)
- Chance of flooding over 30 yrs
- 0.0%
- Est. flood insurance / yr
- $507 – $1,088
Fire risk 2/10 · Minimal
- Est. fire insurance / yr
- $1,054 – $1,958
Heat risk 4/10 · Minor
- Hot days now (above 107°F)
- 7 days/yr
- Hot days in 30 yrs
- 17 days/yr
Wind risk 2/10 · Minimal
- Chance of severe wind over 30 yrs
- —
Air-quality risk 3/10 · Minor
- Unhealthy air days now
- 3 days/yr
- Unhealthy air days in 30 yrs
- 4 days/yr
Risk factors via First Street. Map © Google.
Why this score? — see what drove the C- grade
The composite is a weighted blend of 9 inputs, each scored 0–100. Each bar is that input's sub-score; the figure is the points it added to the 100-point composite (weight × sub-score).
- Cash flow +15.3/30.0
- ARV discount +12.3/15.0
- DSCR +4.7/10.0
- Schools +4.5/10.0
- Livability +4.0/5.0
- 1% rule +3.7/10.0
- Rent growth +3.7/5.0
- Condition / age +2.5/5.0
- Appreciation +0.0/10.0
$369,900
🖨 Deal sheet (PDF) 📄 Offer letter ✓ Due diligence
Multi-family units
County records classify this as Multi-Family (2-4 Unit). Listing-text estimate: 2 units. confirmed
Listing remarks MLS
Very nice investment property with lots of new inside and out. 3 Bedrooms, 1-1/2 Baths. Liberty School District.
Key facts
- Driveway repair
- Level lot
- Full duplex
Tags
Property features AI
Finance
- Other: Property zoned for multi use
- Financial info: Operating expenses include other items
- HOA & community: No association fees
Exterior
- Parking: Attached parking; Off-street parking (total 2 spaces); Includes a garage
- Utilities: Public water; Public sewer; Individual water heaters
- Home design: Duplex; Residential income property; Two stories
- Construction: Frame construction; Composition roof
- Exterior features: Lot approximately 11,761 square feet; Not in a flood plain
Interior
- Bedrooms: Two 3-bedroom units (one 3-bedroom unit on each floor)
- Bathrooms: One unit with 1 full bath and 1 half bath; One unit with 2 full baths
- Heating & cooling: Forced air heating; Electric cooling
- Interior features: Duplex residential income property; Over 95% current occupancy rate
- Laundry & utility: Inside laundry; Individual water heaters
Neighborhood map
What this means for you Summary
Snapshot
- This is a 2 × 3-bed/1.5-bath units multifamily listed at $370k.
Deal economics
- At list price, monthly cash flow is $134 ($2k/yr) — positive. Per door: $67/mo.
- The deal already cash-flows at list — no discount required.
- To meet the 1% rule (rent ≥ 1% of price), the offer needs to be $320k (13.5% below list).
- Recommended offer: $320k (13.5% below list) — sets the bar for 1% rule.
- Cap rate 6.7% vs local median 2.6% in Liberty — top-decile yield for the area; either an underpriced asset or a hidden risk that comps aren't pricing in. Stress-test before assuming the spread holds.
Location & tenants
- Location reads 81/100 on livability (#15 in MO, #1,487 nationally) — a professional / high-income tenant draw. Strengths: employment A+, cost of living A+, housing A+; Watch: commute F.
- Liberty 53 (suburban): math 41% / reading 59% proficiency, ranked #24 of 324 in MO (top 7%) — acceptable for families but not a draw, mixed tenant base, ~2y average lease; only 15% free/reduced lunch — higher-income household profile.
- Zoned schools: Lillian Schumacher Elem. (math 39% / reading 49%, grade F, #469 of 1,115 statewide, top 42%, 475 students, 34% FRL); Liberty Middle School (math 34% / reading 51%, grade D-, #140 of 391 statewide, top 38%, 638 students, 33% FRL); Liberty High (math 33% / reading 75%, grade C-, #82 of 521 statewide, top 16%, 1,997 students, 22% FRL).
- Market conditions: Rents rising fast (+4.7%/yr); 187 active listings in the ZIP; 1 comparable units currently listed for rent nearby; solid renter incomes; 341 units permitted in Clay County in 2024 (40 in 5+ unit buildings).
- This rent runs 42% of the median local income ($92k/yr) — at the standard rent-burdened threshold; future hikes will face affordability resistance.
Forward outlook
- Local home prices are declining (-3.0%/yr); year-one equity from $3k of loan paydown is wiped out by about $11k of value loss. Plan a longer hold.
- Clay County population projected at +24% by 2050 — long-run rental-demand tailwind backs the buy-and-hold thesis.
Negotiation context
- It's been on market 51 days — a 3% lower offer ($359k) is reasonable based on typical stale-listing flexibility.
- 3 sale attempts since 13y ago; this cycle's ask has dropped $25k (6%) from the opening price — seller is motivated, your offer sets the floor, not the list.
Questions for the listing agent
- It's been on market 51 days. Have you received any prior offers? Is the seller open to a 13% concession, seller financing, or rate buy-down credit?
- Can we see the unit-by-unit rent roll, current vacancy, and any below-market leases? What's the average tenancy length?
- What capital expenditures (roof, boiler, parking lot, exteriors) have been made in the last 5 years, and what's planned in the next 2?
- Is there a deadline driving the sale (1031 exchange, divorce, estate, relocation)? That informs how much negotiation room exists.
- Schools are B-rated — typically a magnet for longer-tenancy family renters. What's the average tenant stay here, and is there a school-zone premium baked into asking?
- What's the average days-on-market for RENTAL listings here right now (not sales)? A rising rental-DOM trend means longer vacancies and softer asking-rent achievability than the comps imply.
- What's the recent tenant-quality profile in this submarket — average credit score on applications, eviction rate, late-payment / NSF rate, and stable-employment percentage? A property-management company in the area should have these aggregated.
- How much new apartment / multifamily construction is in the pipeline within 1–3 miles? Heavy new supply (>2% of stock underway) typically softens rents 12–24 months out; light construction supports rent growth.
Investment metrics
- 1% rule
- 0.87% ✗
- Cap rate
- 6.73%
- Cash-on-cash
- 1.55%
- DSCR
- 1.07
- GRM
- 9.6
CMA / ARV
- ARV (median comp)
- $413,940
- List price
- $369,900
- Delta
- -10.64%
- Verdict
- UNDERPRICED
- Comps
- 16 within 1.0 mi
Projected returns pro-forma
-3.0% appreciation · 4.69% rent growth · sell at horizon
- IRR
- -12.1%
- Equity multiple
- 0.56×
- Total profit
- $-45,920
- Equity at exit
- $55,153
- IRR
- -0.7%
- Equity multiple
- 0.95×
- Total profit
- $-5,694
- Equity at exit
- $31,982
Cash invested: $103,572 (down + closing). Projections, not guarantees.
Landlord ↔ Tenant lean methodology
- Overall (STATE)
- 81 Strongly Landlord-Friendly
- State Missouri
- 81 Strongly Landlord-Friendly · R+10
- County
- — inherits STATE
- City
- — inherits STATE
ZIP-level market 64068
- Rents YoY
- 4.7%
- Active inventory
- 187
- Price-to-rent
- 19.3×
Monthly cashflow live
- Estimated rent
- $3,201 high interval (Pro) →
- Mortgage (P&I)
- −$1,940
- Tax from tax record
- −$301 /mo · $3,610/yr
- Insurance
- −$154
- HOA
- −$0
- Vacancy / Maint / Mgmt
- −$672
- Net cashflow
- $134
Break-even live
Sensitivity live
| Price | -10% $343 | -5% $239 | +0% $134 | +5% $29 | +10% $-75 |
|---|---|---|---|---|---|
| Rent | -10% $-119 | -5% $8 | +0% $134 | +5% $260 | +10% $387 |
| Rate | -1.0pp $320 | -0.5pp $228 | base $134 | +0.5pp $38 | +1.0pp $-59 |
2-unit breakdown (identical units grouped — click to expand)
| Units | Beds | Baths | Est. rent |
|---|---|---|---|
| 2× units | 3 | 1.5 | $3,200 |
| #1 | 3 | 1.5 | $1,600 |
| #2 | 3 | 1.5 | $1,600 |
| Total (2 units) | $3,201 | ||
UW: 25.0% down · 7.5% · 30yr · 1.5% tax · 5.0% vac · 8.0% maint · 8.0% mgmt
Financing live
Cash to close
- Down payment
- $92,475
- Closing costs
- $11,097
- Reserves months
- —
- Total cash needed
- —
Loan-product check · same deal, 3 products live
Conventional
25% down · 7.5% · 30yr
- Down + closing
- —
- Monthly P&I
- —
- Monthly cashflow
- —
- DSCR
- —
- Eligible?
- —
Personal DTI + credit; lowest rate.
DSCR
20% down · 8.5% · 30yr
- Down + closing
- —
- Monthly P&I
- —
- Monthly cashflow
- —
- DSCR
- —
- Eligible?
- —
No personal income docs; deal must DSCR.
Hard money
10% down · 12.0% · 12mo
- Down + closing
- —
- Monthly P&I
- —
- Monthly cashflow
- —
- DSCR
- —
- Eligible?
- —
Short-term bridge; refi at stabilization.
Rent comps 1 comps
| Address | Beds | Baths | Sqft | Rent | $/sqft | DOM | Units | Dist |
|---|---|---|---|---|---|---|---|---|
| 633 N Gallatin St Liberty, MO | 4.0 | 2.0 | 1850 | $1,895 | $1.02 | 25d | 1 | 1.16mi |
Listing history 22 events
-
2026-06-21days on market $369,900 Active 51 DOM
-
2026-06-18days on market $369,900 Active 48 DOM
-
2026-06-17days on market $369,900 Active 47 DOM
-
2026-06-16days on market $369,900 Active 46 DOM
-
2026-06-15days on market $369,900 Active 45 DOM
-
2026-06-13days on market $369,900 Active 43 DOM
-
2026-06-09days on market $369,900 Active 39 DOM
-
2026-06-08days on market $369,900 Active 38 DOM
-
2026-06-07days on market $369,900 Active 37 DOM
-
2026-06-03days on market $369,900 Active 33 DOM
-
2026-06-02days on market $369,900 Active 32 DOM
-
2026-06-01days on market $369,900 Active 31 DOM
-
2026-05-31days on market $369,900 Active 30 DOM
-
2026-05-01$395,000 Active 230-char remark
-
2017-11-20soldstatus
-
2017-11-17soldstatus Sold 112-char remark
Show marketing remark (112 chars)
Very nice investment property with lots of new inside and out. 3 Bedrooms, 1-1/2 Baths. Liberty School District.
-
2017-10-23historical Contingent - Accepting Backup Offers 112-char remark
Show marketing remark (112 chars)
Very nice investment property with lots of new inside and out. 3 Bedrooms, 1-1/2 Baths. Liberty School District.
-
2017-10-12$210,000 Active 112-char remark
Show marketing remark (112 chars)
Very nice investment property with lots of new inside and out. 3 Bedrooms, 1-1/2 Baths. Liberty School District.
-
2013-08-16soldstatus
-
2013-08-16soldstatus
-
2013-06-05$162,000
-
2006-11-27soldstatus
ⓘ Source: listings_history table (triggers on properties + properties_extension) + one-shot
backfill from property_details.listing_events for pre-trigger history.
Tax reassessment forecast MO · Resets to sale price
- Current annual tax
- $3,610 · $301/mo
- Projected year-2 tax
- $3,610 · $301/mo
- Expected delta
- $0/yr ($0/mo · 0.0%)
ⓘ Screening estimate from a state-policy table — verify with the county assessor before closing.
Climate risk First Street
- Flood 1/10 Low FEMA zone X (unshaded) · 0% chance over 30 yrs
- Wildfire 2/10 Low
- Heat 4/10 Moderate 7 d/yr ≥107°F today · 17 d/yr by 30 yrs out
- Wind 2/10 Low
- Air quality 3/10 Moderate 3 unhealthy d/yr today · 4 by 30 yrs out
Nearby sold comps map
Loading sold comps map…
Walkable amenities ~0.75 mi
Loading nearby amenities…
Taxation est. · year 1
- Rental income
- $38,412
- − Mortgage interest
- −$20,720
- − Property taxes
- −$3,610
- − Insurance
- −$1,850
- − Repairs & maintenance
- −$3,073
- − Management
- −$3,073
- − Depreciation
- −$10,761
- Taxable loss
- −$4,674
- Est. tax savings @ 24.0%
- +$1,122
- After-tax cash flow
- $2,730/yr
For passive investors: Depreciation is non-cash, so a rental often shows a tax loss while cash-flowing — sheltering income. Rental losses are passive: they offset passive income freely, and up to $25,000/yr can offset ordinary (W-2) income if you actively participate and your MAGI is under $100k (phasing out to $0 by $150k); unused losses carry forward. On sale, claimed depreciation is recaptured at up to 25%, and gains may owe capital-gains tax (a 1031 exchange can defer both). Figures are a year-1 estimate at your 24.0% rate — not tax advice; consult a CPA.
Schools (NCES district)
- District
- Liberty 53
- NCES district ID
- 2918540
- Math proficiency
- 41% ▼ -9.00%
- Reading proficiency
- 59% ▼ -3.00%
- Median HH income
- $78,226
- Composite
- 45.41/100
- National rank
- #2624
- State rank
- #24 of 324 in MO
Livability — Liberty
- Score
- 81/100
- State rank
- #15
- US rank
- #1487
Category grades
Schools grade is shown separately in the Schools card above.
Census & demographics
- Census place
- Liberty, MO
- County
- Clay County · 220,651 people
- City population
- 37,758
- Metro
- Kansas City, MO-KS
- Population (ZIP)
- 37,758
- Household income
- $92,297
- Rent vs Own
- Severe rent burden
- 695.0
Population outlook (Clay County) Hauer SSP2
- Today (2025)
- 266,022 people
- By 2030
- 280,057 · +5.3%
- By 2040
- 306,153 · +15.1%
- By 2050
- 328,630 · +23.5%
- By 2075
- 375,182 · +41.0%
- By 2100
- 392,861 · +47.7%
Race, ethnicity, and origin ACS 2023
- Neighborhood character
- Predominantly White (85%)
- Race & ethnicity
- White 85% Hispanic / Latino 5% Two or more races 5% Black 4% Asian 2%
- Hispanic origin (detail)
- Mexican 3%
- Common ancestry
- Lithuanian 3% Italian 3% Slovak 3%
- Foreign-born
- 2% · Canada, China
- Languages at home
- 97% English-only · Spanish 1%
Political lean MEDSL · Clay
- 2024 margin
- Lean R (+5.6) · D 46.4% · R 52.0% · Other 1.6%
- 2008→2024 swing
- -4.9pp toward R · 2008: -0.7pp · 2024: -5.6pp
- All cycles
- 2024: R+5.6 2020: R+4.1 2016: R+11.1 2012: R+8.4 2008: R+0.7
Not yet ingested
- Civics
- —
Market trends
- HPI YoY
- ▼ -233.70%
- Current HPI
- 223.1569
- Rent YoY
- ▲ 4.69%
- Metro
- Kansas City, MO-KS
- State GDP YoY
- ▲ 1.84%
- F500 in state
- 20
Industry mix (Fortune 500 HQ in MO)
| Industry | F500 HQs | Revenue |
|---|---|---|
| Healthcare | 1 | $163B |
|
||
| Insurance | 1 | $21B |
|
||
| Industrial Technology | 1 | $17B |
|
||
| Retail | 1 | $16B |
|
||
| Industrial Distribution | 1 | $10B |
|
||
| Utilities | 1 | $9B |
|
||
Price history
+128.3% since first listed10 events — show timeline
- 2026-05-30 Price Changed $369,900 Heartland MLS as Distributed by MLS Grid
- 2026-05-01 Listed $395,000 Heartland MLS as Distributed by MLS Grid
- 2017-11-20 Sold (Public Records) — Public Records
- 2017-11-17 Sold (MLS) — Heartland MLS as Distributed by MLS Grid
- 2017-10-23 Contingent — Heartland MLS as Distributed by MLS Grid
- 2017-10-12 Listed $210,000 Heartland MLS as Distributed by MLS Grid
- 2013-08-16 Sold (Public Records) — Public Records
- 2013-08-16 Sold (MLS) — Heartland MLS as Distributed by MLS Grid
- 2013-06-05 Listed $162,000 Heartland MLS as Distributed by MLS Grid
- 2006-11-27 Sold (Public Records) — Public Records
Property tax history
+5.5%/yrLatest (2025): $3,610 · +4.6% YoY. Source: county tax records.
Cash-flow waterfall
monthlySold comps — $/sqft
last 12 mo · ≤1 miLoading sold comps…