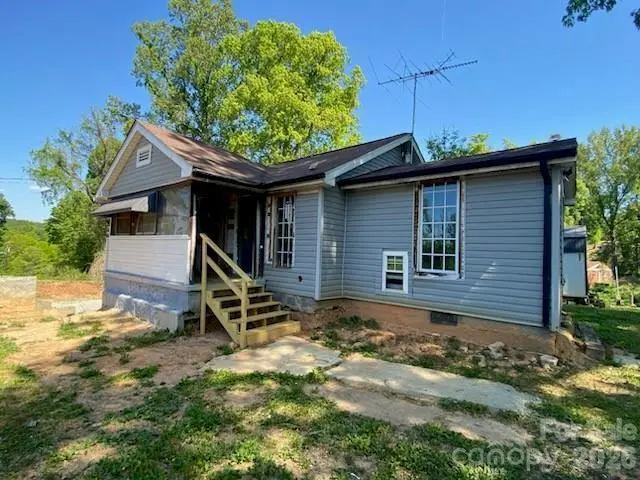
2112 Harpertown Cir
Lenoir, NC 28645
$40,000B-
2 bd · 1.5 ba ·
744 sqft ·
Built 1957
· SingleFamily
· Active
· 41 DOM
Cashflow @ list (25.0% down · 7.5%)
Estimated rent
$1,112/mo
Mortgage (P&I)
−$210
Tax + insurance
−$61
HOA
−$0
Vac / Maint / Mgmt
−$234
Net cashflow
$608/mo
Annual
$7,295/yr
Cap rate
24.53%
Cash-on-cash
65.13%
DSCR
3.90
1% rule
2.78%
Cash to close
$11,200
Investor read
- This is a 2-bed/1.5-bath single-family listed at $40k.
- At list price, monthly cash flow is $608 ($7k/yr) — positive.
- The deal already cash-flows at list — no discount required.
- Meets the 1% rule at list price ($1k rent vs $40k).
- It's been on market 41 days — a 3% lower offer ($39k) is reasonable based on typical stale-listing flexibility.
- Recommended offer: $39k (3.0% below list) — sets the bar for market timing.
- Local home prices are declining (-3.0%/yr); year-one equity from $277 of loan paydown is wiped out by about $1k of value loss. Plan a longer hold.
- Location reads 70/100 on livability (#139 in NC) — a middle-class / working-renter tenant base. Strengths: cost of living A+, housing A+, health & safety A+; Watch: crime D+, amenities D, commute F.
- Caldwell County Schools (suburban): math 38% / reading 46% proficiency, ranked #106 of 178 in NC (top 60%) — families likely to look elsewhere, expect single-tenant / working-renter base with shorter leases.
- Zoned schools: Valmead Elementary (287 students, 99% FRL); West Caldwell High (math 37% / reading 52%, grade F, #352 of 535 statewide, top 68%, 753 students, 68% FRL) — zoned schools average 83% FRL vs 51% district-wide (32 pts higher); higher-poverty schools than district average — tighter screening recommended.
- Watch-outs: built in 1957 — expect roof / HVAC / electrical / plumbing capex.
- Market conditions: 465 active listings in the ZIP; 217 units permitted in Caldwell County in 2024 (0 in 5+ unit buildings).
- Caldwell County population projected at -23% by 2050 — secular population decline; favor cash flow + early exit over multi-decade hold.
- 2 sale attempts; this cycle's ask has dropped $6k (13%) from the opening price — seller is motivated, your offer sets the floor, not the list.
- At projected returns (-3.0% appreciation + 3.0% rent growth), your $11k cash investment doubles in ~2 years — after that, you're playing with house money.
- Cap rate 24.5% vs local median 2.7% in Lenoir — top-decile yield for the area; either an underpriced asset or a hidden risk that comps aren't pricing in. Stress-test before assuming the spread holds.
Questions for listing agent
- It's been on market 41 days. Have you received any prior offers? Is the seller open to a 3% concession, seller financing, or rate buy-down credit?
- Built in 1957 — when were the roof, HVAC, electrical panel, plumbing, and water heater last replaced?
- Is there a deadline driving the sale (1031 exchange, divorce, estate, relocation)? That informs how much negotiation room exists.
- Schools are F-rated, which usually means shorter tenancies and higher turnover. Who's the typical renter profile here, and what's been the actual vacancy rate?
- Crime grade is D in this area — have there been break-ins, vandalism, or insurance claims at this property in the last 3 years? What carrier currently insures it and at what premium?
- What's the average days-on-market for RENTAL listings here right now (not sales)? A rising rental-DOM trend means longer vacancies and softer asking-rent achievability than the comps imply.
- What's the recent tenant-quality profile in this submarket — average credit score on applications, eviction rate, late-payment / NSF rate, and stable-employment percentage? A property-management company in the area should have these aggregated.
- How much new for-sale + rental construction is in the pipeline within 1–3 miles? Heavy new supply typically softens prices + rents 12–24 months out; constrained supply supports both.
CashFlowRE · CFR-0BK7CME89SVVP9
· Data 2 weeks ago
cashflowre.app · 2026-05-29