2112 Harpertown Cir · Lenoir, NC
Flood risk 1/10 · Minimal
- FEMA flood zone
- X (unshaded)
- Chance of flooding over 30 yrs
- 0.0%
- Est. flood insurance / yr
- $507 – $1,088
Fire risk 3/10 · Minor
- Est. fire insurance / yr
- $906 – $1,684
Heat risk 4/10 · Minor
- Hot days now (above 103°F)
- 7 days/yr
- Hot days in 30 yrs
- 18 days/yr
Wind risk 2/10 · Minimal
- Chance of severe wind over 30 yrs
- 1.0%
Air-quality risk 2/10 · Minimal
- Unhealthy air days now
- 1 days/yr
- Unhealthy air days in 30 yrs
- 1 days/yr
Risk factors via First Street. Map © Google.
Why this score? — see what drove the B- grade
The composite is a weighted blend of 9 inputs, each scored 0–100. Each bar is that input's sub-score; the figure is the points it added to the 100-point composite (weight × sub-score).
- Cash flow +30.0/30.0
- 1% rule +10.0/10.0
- DSCR +10.0/10.0
- ARV discount +7.5/15.0
- Schools +3.5/10.0
- Livability +3.5/5.0
- Rent growth +2.5/5.0
- Condition / age +2.5/5.0
- Appreciation +0.0/10.0
$40,000
🖨 Deal sheet 📄 Offer letter ✓ Due diligence
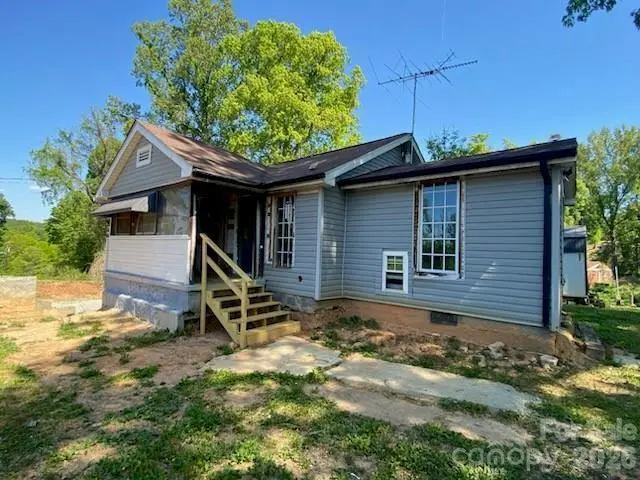
Listing remarks
Ready to take on a full renovation project? This 2 bedroom, 1 bath home is ready for someone to bring it back to life. Detached storage shed included. Please note listing agent cannot represent buyers. Please reach out to any agent of your choice for questions or to schedule a showing. Listing agent and seller are only available Monday-Friday 8:30 am-5:30 pm. Property needs a lot of repairs, please use caution when viewing. Deferred maintenance/plumbing/electrical issues. Heat pump inoperable, no AC, structural/foundation issues. Exposed exterior plumbing. Active termites. Utilities are not on and cannot be cut on due to plumbing/electrical. No septic permit on file. Fence may encroach; no
Key facts
- 9,147 sq ft lot
- Built 1957
- Listed 41 days
Tags
Property features AI
Finance
- Other: Additional equipment or features noted as 'Other - See Remarks'
- HOA & community: No HOA
Exterior
- Parking: Driveway parking (no main-level garage)
- Utilities: City water; Septic system installed
- Home design: Single-family residence; Site-built construction; One-story; R-R zoning
- Construction: Vinyl exterior; Crawl space foundation
- Exterior features: Lot approximately 0.21 acres; Road access: dirt, gravel, and paved; Publicly maintained road
Interior
- Kitchen: No kitchen appliances listed
- Bedrooms: 2 bedrooms on the main level
- Bathrooms: 1 full bathroom (main level)
- Heating & cooling: Heat pump heating; No central cooling listed
- Interior features: 6 total rooms; No built-in appliances listed
- Laundry & utility: Dedicated laundry room
Neighborhood map
What this means for you Summary
Snapshot
- This is a 2-bed/1.5-bath single-family listed at $40k.
Deal economics
- At list price, monthly cash flow is $608 ($7k/yr) — positive.
- The deal already cash-flows at list — no discount required.
- Meets the 1% rule at list price ($1k rent vs $40k).
- Recommended offer: $39k (3.0% below list) — sets the bar for market timing.
- Cap rate 24.5% vs local median 2.7% in Lenoir — top-decile yield for the area; either an underpriced asset or a hidden risk that comps aren't pricing in. Stress-test before assuming the spread holds.
Location & tenants
- Location reads 70/100 on livability (#139 in NC) — a middle-class / working-renter tenant base. Strengths: cost of living A+, housing A+, health & safety A+; Watch: crime D+, amenities D, commute F.
- Caldwell County Schools (suburban): math 38% / reading 46% proficiency, ranked #106 of 178 in NC (top 60%) — families likely to look elsewhere, expect single-tenant / working-renter base with shorter leases.
- Zoned schools: Valmead Elementary (287 students, 99% FRL); West Caldwell High (math 37% / reading 52%, grade F, #352 of 535 statewide, top 68%, 753 students, 68% FRL) — zoned schools average 83% FRL vs 51% district-wide (32 pts higher); higher-poverty schools than district average — tighter screening recommended.
- Market conditions: 465 active listings in the ZIP; 217 units permitted in Caldwell County in 2024 (0 in 5+ unit buildings).
Forward outlook
- Local home prices are declining (-3.0%/yr); year-one equity from $277 of loan paydown is wiped out by about $1k of value loss. Plan a longer hold.
- Caldwell County population projected at -23% by 2050 — secular population decline; favor cash flow + early exit over multi-decade hold.
- At projected returns (-3.0% appreciation + 3.0% rent growth), your $11k cash investment doubles in ~2 years — after that, you're playing with house money.
Negotiation context
- It's been on market 41 days — a 3% lower offer ($39k) is reasonable based on typical stale-listing flexibility.
- 2 sale attempts; this cycle's ask has dropped $6k (13%) from the opening price — seller is motivated, your offer sets the floor, not the list.
Risks & watch-outs
- Watch-outs: built in 1957 — expect roof / HVAC / electrical / plumbing capex.
Questions for the listing agent
- It's been on market 41 days. Have you received any prior offers? Is the seller open to a 3% concession, seller financing, or rate buy-down credit?
- Built in 1957 — when were the roof, HVAC, electrical panel, plumbing, and water heater last replaced?
- Is there a deadline driving the sale (1031 exchange, divorce, estate, relocation)? That informs how much negotiation room exists.
- Schools are F-rated, which usually means shorter tenancies and higher turnover. Who's the typical renter profile here, and what's been the actual vacancy rate?
- Crime grade is D in this area — have there been break-ins, vandalism, or insurance claims at this property in the last 3 years? What carrier currently insures it and at what premium?
- What's the average days-on-market for RENTAL listings here right now (not sales)? A rising rental-DOM trend means longer vacancies and softer asking-rent achievability than the comps imply.
- What's the recent tenant-quality profile in this submarket — average credit score on applications, eviction rate, late-payment / NSF rate, and stable-employment percentage? A property-management company in the area should have these aggregated.
- How much new for-sale + rental construction is in the pipeline within 1–3 miles? Heavy new supply typically softens prices + rents 12–24 months out; constrained supply supports both.
Investment metrics
- 1% rule
- 2.78% ✓
- Cap rate
- 24.53%
- Cash-on-cash
- 65.13%
- DSCR
- 3.90
- GRM
- 3.0
CMA / ARV
- ARV (on-the-fly)
- $167,400
- Comps found
- 3
Show comp detail 3 sales within ~0.75 mi
| Address | Dist | Beds/Ba | Sqft | Sold | Price | $/sf | Match |
|---|---|---|---|---|---|---|---|
| 505 NW Charles Pl NW | 0.66mi | 2/1.0 | 835 (+12%) | 4mo | $188,000 | $225 | 44 |
| 1448 Piedmont Dr | 0.70mi | 2/1.0 | 672 (-10%) | 19mo | $173,000 | $257 | 34 |
| 715 Broadway St NW | 0.75mi | 2/1.0 | 848 (+14%) | 10mo | $180,000 | $212 | 31 |
Match score weights: distance 35% · size 25% · config 20% · recency 20%. Top-matched comps best support the ARV.
Projected returns pro-forma
-3.0% appreciation · 3.0% rent growth · sell at horizon
- IRR
- 64.3%
- Equity multiple
- 3.88×
- Total profit
- $32,249
- Equity at exit
- $5,964
- IRR
- 68.7%
- Equity multiple
- 7.96×
- Total profit
- $77,990
- Equity at exit
- $3,458
Cash invested: $11,200 (down + closing). Projections, not guarantees.
Landlord ↔ Tenant lean methodology
- Overall (STATE)
- 85 Strongly Landlord-Friendly
- State North Carolina
- 85 Strongly Landlord-Friendly · R+3
- County
- — inherits STATE
- City
- — inherits STATE
ZIP-level market 28645
- Home prices YoY
- -17.4%
- Active inventory
- 465
- Price-to-rent
- 3.0×
Monthly cashflow live
- Estimated rent
- $1,112 medium interval (Pro) →
- Mortgage (P&I)
- −$210
- Tax from tax record
- −$44 /mo · $532/yr
- Insurance
- −$17
- HOA
- −$0
- Vacancy / Maint / Mgmt
- −$234
- Net cashflow
- $608
Break-even live
UW: 25.0% down · 7.5% · 30yr · 1.5% tax · 5.0% vac · 8.0% maint · 8.0% mgmt
Financing live
Cash to close
- Down payment
- $10,000
- Closing costs
- $1,200
- Reserves months
- —
- Total cash needed
- —
Loan-product check · same deal, 3 products live
Conventional
25% down · 7.5% · 30yr
- Down + closing
- —
- Monthly P&I
- —
- Monthly cashflow
- —
- DSCR
- —
- Eligible?
- —
Personal DTI + credit; lowest rate.
DSCR
20% down · 8.5% · 30yr
- Down + closing
- —
- Monthly P&I
- —
- Monthly cashflow
- —
- DSCR
- —
- Eligible?
- —
No personal income docs; deal must DSCR.
Hard money
10% down · 12.0% · 12mo
- Down + closing
- —
- Monthly P&I
- —
- Monthly cashflow
- —
- DSCR
- —
- Eligible?
- —
Short-term bridge; refi at stabilization.
Listing history 7 events
-
2026-06-03days on market $40,000 Active 41 DOM
-
2026-06-02days on market $40,000 Active 40 DOM
-
2026-05-31days on market $40,000 Active 38 DOM
-
2026-05-30days on market $40,000 Active 37 DOM
-
2026-05-01status Active
-
2026-04-28historical Active Under Contract
-
2026-04-23$46,000 Active
ⓘ Source: listings_history table (triggers on properties + properties_extension) + one-shot
backfill from property_details.listing_events for pre-trigger history.
Tax reassessment forecast NC · Resets to sale price
- Current annual tax
- $532 · $44/mo
- Projected year-2 tax
- $532 · $44/mo
- Expected delta
- $0/yr ($0/mo · 0.0%)
ⓘ Screening estimate from a state-policy table — verify with the county assessor before closing.
Climate risk First Street
- Flood 1/10 Low FEMA zone X (unshaded) · 0% chance over 30 yrs
- Wildfire 3/10 Moderate
- Heat 4/10 Moderate 7 d/yr ≥103°F today · 18 d/yr by 30 yrs out
- Wind 2/10 Low 100% chance of damaging wind over 30 yrs
- Air quality 2/10 Low 1 unhealthy d/yr today · 1 by 30 yrs out
Nearby sold comps map
Loading sold comps map…
Walkable amenities ~0.75 mi
Loading nearby amenities…
Taxation est. · year 1
- Rental income
- $13,347
- − Mortgage interest
- −$2,241
- − Property taxes
- −$532
- − Insurance
- −$200
- − Repairs & maintenance
- −$1,068
- − Management
- −$1,068
- − Depreciation
- −$1,164
- Taxable income
- $7,075
- Est. tax owed @ 24.0%
- −$1,698
- After-tax cash flow
- $5,597/yr
For passive investors: Depreciation is non-cash, so a rental often shows a tax loss while cash-flowing — sheltering income. Rental losses are passive: they offset passive income freely, and up to $25,000/yr can offset ordinary (W-2) income if you actively participate and your MAGI is under $100k (phasing out to $0 by $150k); unused losses carry forward. On sale, claimed depreciation is recaptured at up to 25%, and gains may owe capital-gains tax (a 1031 exchange can defer both). Figures are a year-1 estimate at your 24.0% rate — not tax advice; consult a CPA.
Schools (NCES district)
- District
- Caldwell County Schools
- NCES district ID
- 3700580
- Math proficiency
- 38% ▲ 1.00%
- Reading proficiency
- 46% ▼ -1.00%
- Median HH income
- $37,165
- Composite
- 34.9/100
- National rank
- #5079
- State rank
- #106 of 178 in NC
Livability — Lenoir
- Score
- 70/100
- State rank
- #139
- US rank
- #7940
Category grades
Schools grade is shown separately in the Schools card above.
Census & demographics
- Population (ZIP)
- 46,237
Population outlook (Caldwell County) Hauer SSP2
- Today (2025)
- 77,603 people
- By 2030
- 74,714 · -3.7%
- By 2040
- 67,732 · -12.7%
- By 2050
- 59,938 · -22.8%
- By 2075
- 43,232 · -44.3%
- By 2100
- 28,894 · -62.8%
Race, ethnicity, and origin ACS 2023
- Neighborhood character
- Predominantly White (83%)
- Race & ethnicity
- White 83% Hispanic / Latino 8% Black 6% Two or more races 5%
- Hispanic origin (detail)
- Mexican 3%
- Common ancestry
- Slovak 3% Serbian 2% Italian 2%
- Foreign-born
- 4% · Canada, Vietnam
- Languages at home
- 93% English-only · Spanish 5% Other Asian/Pacific 1%
Political lean MEDSL · Caldwell
- 2024 margin
- Solid R (+52.6) · D 23.4% · R 76.0%
- 2008→2024 swing
- -22.9pp toward R · 2008: -29.7pp · 2024: -52.6pp
- All cycles
- 2024: R+52.6 2020: R+51.1 2016: R+50.6 2012: R+35.7 2008: R+29.7
Not yet ingested
- Civics
- —
Market trends
- HPI YoY
- ▼ -56.03%
- Current HPI
- 265.0987
- Rent YoY
- —
- Metro
- —
- State GDP YoY
- ▲ 3.28%
- F500 in state
- 26
Industry mix (Fortune 500 HQ in NC)
| Industry | F500 HQs | Revenue |
|---|---|---|
| Financial Services | 2 | $213B |
|
||
| Retail | 2 | $95B |
|
||
| Industrial Conglomerate | 1 | $38B |
|
||
| Metals / Steel | 1 | $35B |
|
||
| Utilities | 1 | $30B |
|
||
| Industrial Machinery | 1 | $19B |
|
||
Price history
3 events — show timeline
- 2026-05-01 Relisted — CANOPYMLS as Distributed by MLS Grid
- 2026-04-28 Contingent — CANOPYMLS as Distributed by MLS Grid
- 2026-04-23 Listed $46,000 CANOPYMLS as Distributed by MLS Grid
Property tax history
+7.9%/yrLatest (2025): $532 · +147.4% YoY. Source: county tax records.
Cash-flow waterfall
monthlySold comps — $/sqft
last 12 mo · ≤1 miLoading sold comps…