None
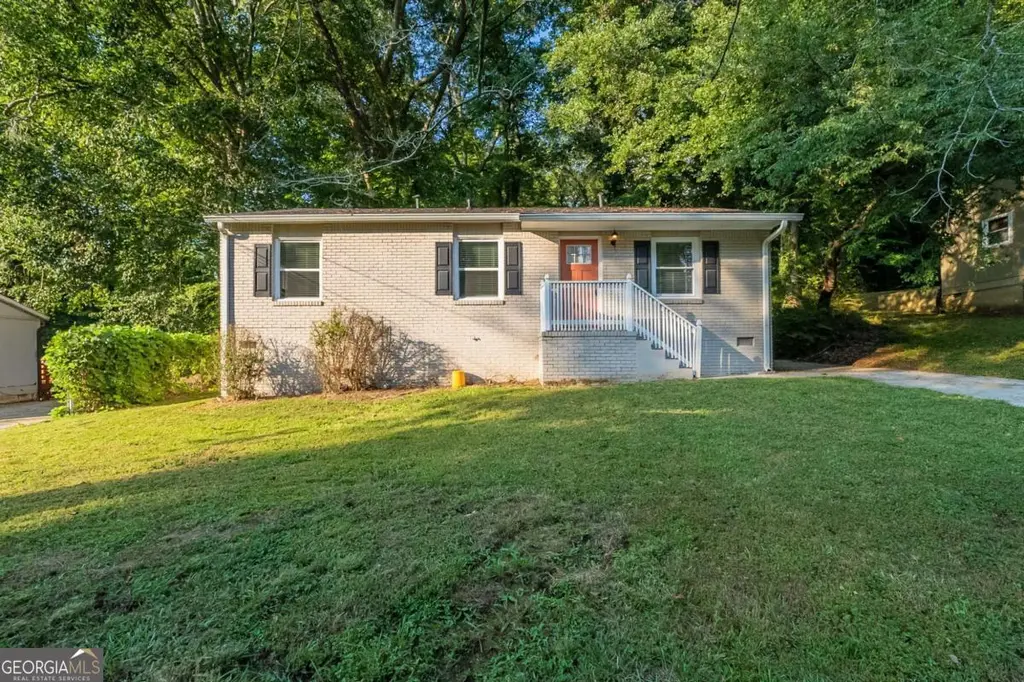
Atlanta, GA 30315
$182,198D+
3 bd · 2.0 ba ·
1,025 sqft ·
Built 1960
· SingleFamily
· Active
· 1 DOM
Cashflow @ list (25.0% down · 7.5%)
Estimated rent
$1,871/mo
Mortgage (P&I)
−$955
Tax + insurance
−$388
HOA
−$0
Vac / Maint / Mgmt
−$393
Net cashflow
$135/mo
Annual
$1,618/yr
Cap rate
7.18%
Cash-on-cash
3.17%
DSCR
1.14
1% rule
1.03%
Cash to close
$51,015
Investor read
- This is a 3-bed/2.0-bath single-family listed at $182k.
- At list price, monthly cash flow is $135 ($2k/yr) — positive.
- The deal already cash-flows at list — no discount required.
- Meets the 1% rule at list price ($2k rent vs $182k).
- Only 1 days on market — expect competitive offers; lowballing is unlikely to land.
- Local home prices are declining (-3.0%/yr); year-one equity from $1k of loan paydown is wiped out by about $5k of value loss. Plan a longer hold.
- Location reads 83/100 on livability (#6 in GA, #919 nationally) — a professional / high-income tenant draw. Strengths: amenities A+, commute A+, housing A+; Watch: cost of living C-.
- Atlanta Public Schools (urban): math 28% / reading 35% proficiency, ranked #80 of 174 in GA (top 46%) — families likely to look elsewhere, expect single-tenant / working-renter base with shorter leases; 71% free/reduced lunch — lower-income household profile, screen leases tightly.
- Zoned schools: Beecher Hills Elementary School (241 students, 100% FRL); Martin L. King Jr. Middle School (math 16% / reading 23%, grade F, #356 of 470 statewide, top 78%, 818 students, 100% FRL); South Atlanta High School (math 2% / reading 12%, grade F, #385 of 424 statewide, top 92%, 928 students, 100% FRL) — zoned schools average 100% FRL vs 71% district-wide (29 pts higher); higher-poverty schools than district average — tighter screening recommended.
- Zoned-school proficiency averages 13% at this address vs 32% district-wide (-18 pts) — the specific schools serving this property underperform the Atlanta Public Schools average; the district grade overstates school quality for this exact location.
- Market conditions: Rents rising (+3.2%/yr); 378 active listings in the ZIP; 39 comparable units currently listed for rent nearby; rentals at typical pace (median 22d on market — plan ~3-4 weeks tenant-placement turnaround); 11,565 units permitted in Fulton County in 2024 (8,159 in 5+ unit buildings).
- Fulton County population projected at +38% by 2050 — long-run rental-demand tailwind backs the buy-and-hold thesis.
- 3 sale attempts since 17y ago with the ask held roughly flat each time — persistent listings suggest the price (not the market) is what's stuck; bring a comps-based counter.
- Current owner paid $81k; list at $182k implies a 125% gain — meaningful room to come down on a strong offer.
- Climate carrying-cost: moderate wind risk, 25% chance of damaging wind over 30y; extreme-heat days projected 7→17/yr by 2055 (HVAC capex compounding) — expect insurance premiums to compound above CPI over the hold.
- Cap rate 7.2% vs local median 3.1% in Atlanta — top-decile yield for the area; either an underpriced asset or a hidden risk that comps aren't pricing in. Stress-test before assuming the spread holds.
- This rent runs 44% of the median local income ($51k/yr) — at the standard rent-burdened threshold; future hikes will face affordability resistance.
Questions for listing agent
- Built in 1960 — when were the roof, HVAC, electrical panel, plumbing, and water heater last replaced?
- Is there a deadline driving the sale (1031 exchange, divorce, estate, relocation)? That informs how much negotiation room exists.
- The area grade is low — what's the realistic commute time and amenity access for the typical tenant pool here? Any planned neighborhood developments (good or bad) we should know about?
- What's the average days-on-market for RENTAL listings here right now (not sales)? A rising rental-DOM trend means longer vacancies and softer asking-rent achievability than the comps imply.
- What's the recent tenant-quality profile in this submarket — average credit score on applications, eviction rate, late-payment / NSF rate, and stable-employment percentage? A property-management company in the area should have these aggregated.
- How much new for-sale + rental construction is in the pipeline within 1–3 miles? Heavy new supply typically softens prices + rents 12–24 months out; constrained supply supports both.
CashFlowRE · CFR-0C2ATT8YRSCKE5
· Data 2 days ago
cashflowre.app · 2026-05-29