None · Atlanta, GA
Flood risk 1/10 · Minimal
- FEMA flood zone
- X (unshaded)
- Chance of flooding over 30 yrs
- 0.0%
- Est. flood insurance / yr
- $473 – $860
Fire risk 1/10 · Minimal
- Est. fire insurance / yr
- $963 – $1,789
Heat risk 5/10 · Moderate
- Hot days now (above 105°F)
- 7 days/yr
- Hot days in 30 yrs
- 17 days/yr
Wind risk 5/10 · Moderate
- Chance of severe wind over 30 yrs
- 25.0%
Air-quality risk 4/10 · Minor
- Unhealthy air days now
- 4 days/yr
- Unhealthy air days in 30 yrs
- 6 days/yr
Risk factors via First Street. Map © Google.
Why this score? — see what drove the D+ grade
The composite is a weighted blend of 9 inputs, each scored 0–100. Each bar is that input's sub-score; the figure is the points it added to the 100-point composite (weight × sub-score).
- Cash flow +17.3/30.0
- DSCR +5.4/10.0
- 1% rule +5.3/10.0
- ARV discount +4.9/15.0
- Livability +4.2/5.0
- Rent growth +3.3/5.0
- Schools +2.7/10.0
- Condition / age +2.5/5.0
- Appreciation +0.0/10.0
$182,198
🖨 Deal sheet 📄 Offer letter ✓ Due diligence
Listing remarks MLS
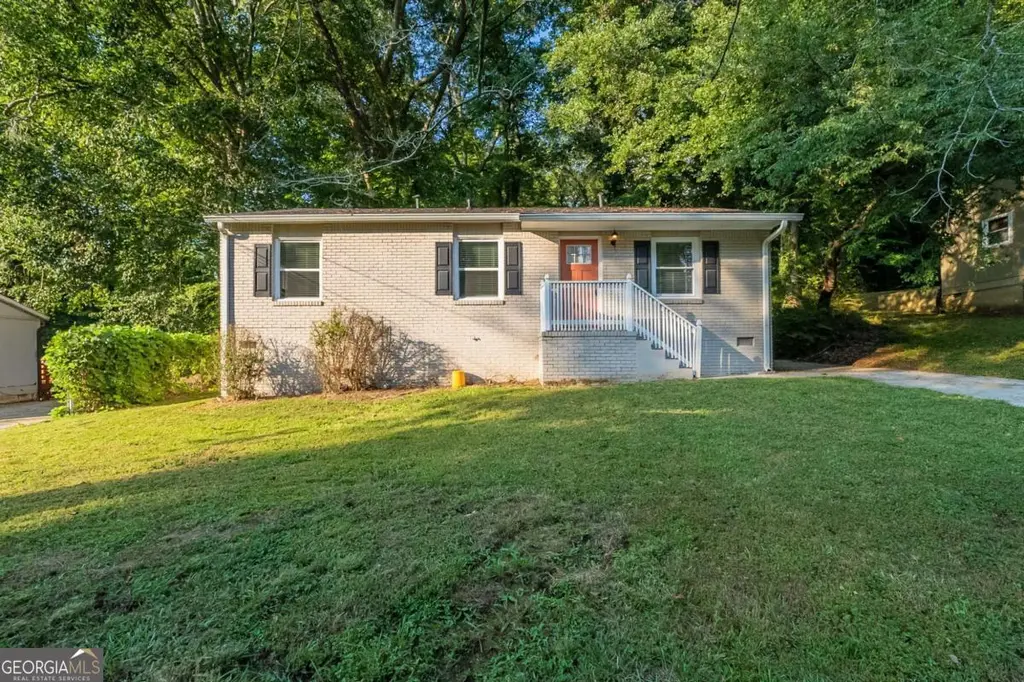
Welcome to this charming opportunity in the heart of Atlanta! Nestled on a quiet street in an established neighborhood, this home offers a warm setting with great potential to make it truly your own. The layout provides a solid foundation for comfortable living, while the surrounding area adds to its appeal with convenient access to downtown Atlanta, major highways, shopping, dining, and local parks. Whether you're a first-time buyer, investor, or someone looking to personalize a home, this property offers the perfect blend of location, possibility, and value. A wonderful chance to create something special in a growing and vibrant area.
Key facts
- Quiet street
- Convenient access
- Local parks
Tags
Property features AI
Exterior
- Parking: Driveway; Open parking available
- Utilities: Water: Other; Sewer: Other; Electric: Other; Other utilities
- Home design: One-level home; Resale property; Brick 4-sides construction; Composition roof; Slab foundation
- Construction: Brick 4-sides construction; Composition roof; Slab foundation
- Exterior features: Deck; Asphalt road frontage on a city street
Interior
- Kitchen: White cabinets; Solid surface counters; Kitchen open to family room; Dishwasher; Electric range; Microwave; Refrigerator
- Bedrooms: Three main-level bedrooms; Bedroom features: Other
- Flooring: Luxury vinyl
- Bathrooms: One full bathroom (main level)
- Heating & cooling: Central air; Electric forced-air heat
- Interior features: Entrance foyer; No common walls; Family room; Crawl space basement
- Laundry & utility: Laundry located in kitchen
Neighborhood map
What this means for you Summary
Snapshot
- This is a 3-bed/2.0-bath single-family listed at $182k.
Deal economics
- At list price, monthly cash flow is $135 ($2k/yr) — positive.
- The deal already cash-flows at list — no discount required.
- Meets the 1% rule at list price ($2k rent vs $182k).
- Cap rate 7.2% vs local median 3.1% in Atlanta — top-decile yield for the area; either an underpriced asset or a hidden risk that comps aren't pricing in. Stress-test before assuming the spread holds.
Location & tenants
- Location reads 83/100 on livability (#6 in GA, #919 nationally) — a professional / high-income tenant draw. Strengths: amenities A+, commute A+, housing A+; Watch: cost of living C-.
- Atlanta Public Schools (urban): math 28% / reading 35% proficiency, ranked #80 of 174 in GA (top 46%) — families likely to look elsewhere, expect single-tenant / working-renter base with shorter leases; 71% free/reduced lunch — lower-income household profile, screen leases tightly.
- Zoned schools: Beecher Hills Elementary School (241 students, 100% FRL); Martin L. King Jr. Middle School (math 16% / reading 23%, grade F, #356 of 470 statewide, top 78%, 818 students, 100% FRL); South Atlanta High School (math 2% / reading 12%, grade F, #385 of 424 statewide, top 92%, 928 students, 100% FRL) — zoned schools average 100% FRL vs 71% district-wide (29 pts higher); higher-poverty schools than district average — tighter screening recommended.
- Zoned-school proficiency averages 13% at this address vs 32% district-wide (-18 pts) — the specific schools serving this property underperform the Atlanta Public Schools average; the district grade overstates school quality for this exact location.
- Market conditions: Rents rising (+3.2%/yr); 378 active listings in the ZIP; 39 comparable units currently listed for rent nearby; rentals at typical pace (median 22d on market — plan ~3-4 weeks tenant-placement turnaround); 11,565 units permitted in Fulton County in 2024 (8,159 in 5+ unit buildings).
- This rent runs 44% of the median local income ($51k/yr) — at the standard rent-burdened threshold; future hikes will face affordability resistance.
Forward outlook
- Local home prices are declining (-3.0%/yr); year-one equity from $1k of loan paydown is wiped out by about $5k of value loss. Plan a longer hold.
- Fulton County population projected at +38% by 2050 — long-run rental-demand tailwind backs the buy-and-hold thesis.
Negotiation context
- Only 1 days on market — expect competitive offers; lowballing is unlikely to land.
- 3 sale attempts since 17y ago with the ask held roughly flat each time — persistent listings suggest the price (not the market) is what's stuck; bring a comps-based counter.
- Current owner paid $81k; list at $182k implies a 125% gain — meaningful room to come down on a strong offer.
Risks & watch-outs
- Climate carrying-cost: moderate wind risk, 25% chance of damaging wind over 30y; extreme-heat days projected 7→17/yr by 2055 (HVAC capex compounding) — expect insurance premiums to compound above CPI over the hold.
Questions for the listing agent
- Built in 1960 — when were the roof, HVAC, electrical panel, plumbing, and water heater last replaced?
- Is there a deadline driving the sale (1031 exchange, divorce, estate, relocation)? That informs how much negotiation room exists.
- The area grade is low — what's the realistic commute time and amenity access for the typical tenant pool here? Any planned neighborhood developments (good or bad) we should know about?
- What's the average days-on-market for RENTAL listings here right now (not sales)? A rising rental-DOM trend means longer vacancies and softer asking-rent achievability than the comps imply.
- What's the recent tenant-quality profile in this submarket — average credit score on applications, eviction rate, late-payment / NSF rate, and stable-employment percentage? A property-management company in the area should have these aggregated.
- How much new for-sale + rental construction is in the pipeline within 1–3 miles? Heavy new supply typically softens prices + rents 12–24 months out; constrained supply supports both.
Investment metrics
- 1% rule
- 1.03% ✓
- Cap rate
- 7.18%
- Cash-on-cash
- 3.17%
- DSCR
- 1.14
- GRM
- 8.1
CMA / ARV
- ARV (on-the-fly)
- $172,200
- Comps found
- 12
Show comp detail 12 sales within ~0.75 mi
| Address | Dist | Beds/Ba | Sqft | Sold | Price | $/sf | Match |
|---|---|---|---|---|---|---|---|
| 2361 Swallow Cir SE | 0.07mi | 3/2.0 | 1,025 (0%) | 1mo | $199,900 | $195 | 96 |
| 97 Harper Rd SE | 0.07mi | 3/1.5 | 1,025 (0%) | 1mo | $154,680 | $151 | 93 |
| 172 Meador Way SE | 0.25mi | 3/2.0 | 1,000 (-2%) | 3mo | $138,900 | $139 | 82 |
| 209 Harper Rd SE | 0.27mi | 3/2.0 | 1,059 (+3%) | 2mo | $253,000 | $239 | 80 |
| 1825 Shadydale Ave SE | 0.55mi | 3/1.5 | 1,046 (+2%) | 0mo | $155,000 | $148 | 68 |
| 287 Banberry Dr | 0.71mi | 3/2.0 | 1,025 (0%) | 0mo | $225,000 | $220 | 66 |
| 2245 Polar Rock Ave SW | 0.62mi | 3/1.0 | 1,000 (-2%) | 2mo | $167,500 | $168 | 61 |
| 5 Adair Ave SE | 0.66mi | 3/1.0 | 1,032 (+1%) | 4mo | $140,000 | $136 | 60 |
| 445 Carey Dr SE | 0.71mi | 3/2.0 | 1,064 (+4%) | 0mo | $234,000 | $220 | 60 |
| 305 Banberry Dr SE | 0.75mi | 3/1.0 | 1,000 (-2%) | 3mo | $135,000 | $135 | 55 |
| 366 Wyndham Way SE | 0.56mi | 3/1.0 | 1,147 (+12%) | 2mo | $187,000 | $163 | 48 |
| 2359 Polar Rock Ave SW | 0.73mi | 2/1.0 (-1) | 900 (-12%) | 2mo | $195,000 | $217 | 35 |
Match score weights: distance 35% · size 25% · config 20% · recency 20%. Top-matched comps best support the ARV.
Projected returns pro-forma
-3.0% appreciation · 3.23% rent growth · sell at horizon
- IRR
- -11.0%
- Equity multiple
- 0.60×
- Total profit
- $-20,425
- Equity at exit
- $27,166
- IRR
- -1.3%
- Equity multiple
- 0.91×
- Total profit
- $-4,616
- Equity at exit
- $15,753
Cash invested: $51,015 (down + closing). Projections, not guarantees.
Landlord ↔ Tenant lean methodology
- Overall (STATE)
- 90 Strongly Landlord-Friendly
- State Georgia
- 90 Strongly Landlord-Friendly · R+3
- County
- — inherits STATE
- City
- — inherits STATE
ZIP-level market 30315
- Rents YoY
- 3.2%
- Active inventory
- 378
- Price-to-rent
- 8.1×
Monthly cashflow live
- Estimated rent
- $1,871 high interval (Pro) →
- Mortgage (P&I)
- −$955
- Tax from tax record
- −$312 /mo · $3,746/yr
- Insurance
- −$76
- HOA
- −$0
- Vacancy / Maint / Mgmt
- −$393
- Net cashflow
- $135
Break-even live
UW: 25.0% down · 7.5% · 30yr · 1.5% tax · 5.0% vac · 8.0% maint · 8.0% mgmt
Financing live
Cash to close
- Down payment
- $45,550
- Closing costs
- $5,466
- Reserves months
- —
- Total cash needed
- —
Loan-product check · same deal, 3 products live
Conventional
25% down · 7.5% · 30yr
- Down + closing
- —
- Monthly P&I
- —
- Monthly cashflow
- —
- DSCR
- —
- Eligible?
- —
Personal DTI + credit; lowest rate.
DSCR
20% down · 8.5% · 30yr
- Down + closing
- —
- Monthly P&I
- —
- Monthly cashflow
- —
- DSCR
- —
- Eligible?
- —
No personal income docs; deal must DSCR.
Hard money
10% down · 12.0% · 12mo
- Down + closing
- —
- Monthly P&I
- —
- Monthly cashflow
- —
- DSCR
- —
- Eligible?
- —
Short-term bridge; refi at stabilization.
Rent comps 39 comps
| Address | Beds | Baths | Sqft | Rent | $/sqft | DOM | Units | Dist |
|---|---|---|---|---|---|---|---|---|
| 2145 Macon Dr SW Atlanta, GA | 3.0 | 1.0 | 1059 | $1,450 | $1.37 | 24d | 1 | 0.23mi |
| 172 Meador Way SE Atlanta, GA | 3.0 | 2.0 | 1100 | $1,950 | $1.77 | 24d | 1 | 0.25mi |
| 76 Schell Rd SE Atlanta, GA | 3.0 | 1.0 | 1080 | $1,623 | $1.50 | 24d | 1 | 0.27mi |
| 73 Polar Rock Rd SW Atlanta, GA | 3.0 | 1.0 | 1098 | $1,850 | $1.68 | 10d | 1 | 0.29mi |
| 2332 Baywood Dr SE Atlanta, GA | 3.0 | 2.0 | 1100 | $1,400 | $1.27 | 18d | 1 | 0.32mi |
| 2197 Polar Rock Pl SW Atlanta, GA | 3.0 | 2.5 | 1000 | $2,700 | $2.70 | 21d | 1 | 0.46mi |
| 2268 Polar Rock Pl SW Atlanta, GA | 3.0 | 1.0 | 925 | $1,575 | $1.70 | 24d | 1 | 0.52mi |
| 1875 Conrad Ave SE Atlanta, GA | 3.0 | 2.0 | 1088 | $1,803 | $1.66 | 22d | 1 | 0.54mi |
| 136 Hillsdale Dr SE Atlanta, GA | 3.0 | 2.0 | 1075 | $1,995 | $1.86 | 24d | 1 | 0.54mi |
| 386 Lindsey Dr SE Atlanta, GA | 3.0 | 1.0 | 1040 | $1,808 | $1.74 | 15d | 1 | 0.56mi |
| 340 Adelle St SE Atlanta, GA | 3.0 | 1.0 | 1122 | $1,500 | $1.34 | 3d | 1 | 0.59mi |
| 2087 Lakewood Trl SE Atlanta, GA | 3.0 | 2.5 | 1056 | $2,256 | $2.14 | 24d | 1 | 0.63mi |
| 52 Claire Dr SE Atlanta, GA | 2.0 | 2.0 | 800 | $1,750 | $2.19 | 19d | 1 | 0.64mi |
| 2019 Pryor Rd SW Atlanta, GA | 2.0 | 2.5 | 1449 | $2,600 | $1.79 | 24d | 1 | 0.79mi |
| 250 Amal Dr SW #7009 Atlanta, GA | 3.0 | 2.5 | 1440 | $1,850 | $1.28 | 8d | 1 | 0.86mi |
| 245 Amal Dr SW #3004 Atlanta, GA | 2.0 | 2.0 | 1402 | $1,800 | $1.28 | 22d | 1 | 0.92mi |
| 1770 Richmond Cir SE Unit 500F Atlanta, GA | 2.0 | 2.0 | 1200 | $1,750 | $1.46 | 24d | 1 | 0.96mi |
| 1770 Richmond Cir SE Unit 1000E Atlanta, GA | 2.0 | 2.0 | 1200 | $1,365 | $1.14 | 24d | 1 | 0.96mi |
| 200 Guerin Rd Holly Springs, NC | 2.0–3.0 | 1.0–1.5 | 947 | $1,349 | $1.42 | 22d | 1 | 0.97mi |
| 1754 Richmond Cir SE Atlanta, GA | 2.0 | 2.0 | 1200 | $1,750 | $1.46 | 8d | 2 | 0.99mi |
| 41 Meldon Ave SE Atlanta, GA | 4.0 | 1.5 | 1323 | $1,495 | $1.13 | 17d | 1 | 1.07mi |
| 2694 Fairlane Dr SE Atlanta, GA | 4.0 | 2.0 | 1372 | $2,800 | $2.04 | 24d | 1 | 1.07mi |
| 585 McWilliams Rd SE #104 Atlanta, GA | 2.0 | 3.0 | 1500 | $2,078 | $1.39 | 20d | 1 | 1.09mi |
| 1515 Jonesboro Rd SE Atlanta, GA | 3.0 | 2.0 | 1360 | $2,300 | $1.69 | 13d | 1 | 1.19mi |
| 2745 Old Hapeville Rd SW Atlanta, GA | 2.0–3.0 | 2.0 | 1007 | $1,375 | $1.36 | 15d | 1 | 1.19mi |
| 2000 Rambling Ln Atlanta, GA | 1.0–3.0 | 1.0–2.0 | 1082 | $1,514 | $1.40 | 1d | 8 | 1.22mi |
| 2786 Old Hapeville Rd SW Atlanta, GA | 2.0 | 1.5 | 1050 | $1,150 | $1.10 | 24d | 1 | 1.24mi |
| 1777 Bond Dr SW Atlanta, GA | 4.0 | 1.5 | 1043 | $1,999 | $1.92 | 24d | 1 | 1.25mi |
| 445 Cleveland Ave SE Atlanta, GA | 2.0–3.0 | 1.0–2.0 | 1014 | $1,591 | $1.57 | 2d | 13 | 1.26mi |
| 91 Thirkield Ave SE Atlanta, GA | 2.0 | 1.0 | 1092 | $1,995 | $1.83 | 24d | 1 | 1.27mi |
| 95 Thirkield Ave SE Atlanta, GA | 3.0 | 2.0 | 1096 | $1,850 | $1.69 | 16d | 1 | 1.27mi |
| 488 Pomona Cir SW Atlanta, GA | 3.0 | 1.0 | 1000 | $1,800 | $1.80 | 24d | 1 | 1.29mi |
| 1455 Jonesboro Rd SE Atlanta, GA | 2.0 | 1.0 | 700 | $2,000 | $2.86 | 24d | 1 | 1.30mi |
| 117 Thayer Ave SE Atlanta, GA | 3.0 | 1.0 | 1241 | $1,666 | $1.34 | 14d | 1 | 1.35mi |
| 643 Langston Dr SW Atlanta, GA | 3.0 | 2.0 | 1180 | $2,000 | $1.69 | 24d | 1 | 1.35mi |
| 174 Moury Ave SW Atlanta, GA | 1.0–3.0 | 1.0–2.0 | 926 | $1,728 | $1.87 | 3d | 6 | 1.41mi |
| 1483 Arthur Langford Jr Pl SW Atlanta, GA | 1.0–2.0 | 1.0 | 825 | $900 | $1.09 | 24d | 7 | 1.42mi |
| 45 Baker Dr SW Atlanta, GA | 3.0 | 2.0 | 1056 | $1,600 | $1.52 | 24d | 1 | 1.43mi |
| 402 McDonough Blvd SE Atlanta, GA | 3.0 | 3.5 | 1270 | $2,350 | $1.85 | 24d | 1 | 1.46mi |
Listing history 2 events
-
2026-06-18remarks 644-char remark
-
2026-06-18$182,198 Active 1 DOM
ⓘ Source: listings_history table (triggers on properties + properties_extension) + one-shot
backfill from property_details.listing_events for pre-trigger history.
Tax reassessment forecast GA · Resets to sale price
- Current annual tax
- $3,746 · $312/mo
- Projected year-2 tax
- $3,746 · $312/mo
- Expected delta
- $0/yr ($0/mo · 0.0%)
ⓘ Screening estimate from a state-policy table — verify with the county assessor before closing.
Climate risk First Street
- Flood 1/10 Low FEMA zone X (unshaded) · 0% chance over 30 yrs
- Wildfire 1/10 Low
- Heat 5/10 Major 7 d/yr ≥105°F today · 17 d/yr by 30 yrs out
- Wind 5/10 Major 25% chance of damaging wind over 30 yrs
- Air quality 4/10 Moderate 4 unhealthy d/yr today · 6 by 30 yrs out
Nearby sold comps map
Loading sold comps map…
Walkable amenities ~0.75 mi
Loading nearby amenities…
Taxation est. · year 1
- Rental income
- $22,455
- − Mortgage interest
- −$10,206
- − Property taxes
- −$3,746
- − Insurance
- −$911
- − Repairs & maintenance
- −$1,796
- − Management
- −$1,796
- − Depreciation
- −$5,300
- Taxable loss
- −$1,300
- Est. tax savings @ 24.0%
- +$312
- After-tax cash flow
- $1,930/yr
For passive investors: Depreciation is non-cash, so a rental often shows a tax loss while cash-flowing — sheltering income. Rental losses are passive: they offset passive income freely, and up to $25,000/yr can offset ordinary (W-2) income if you actively participate and your MAGI is under $100k (phasing out to $0 by $150k); unused losses carry forward. On sale, claimed depreciation is recaptured at up to 25%, and gains may owe capital-gains tax (a 1031 exchange can defer both). Figures are a year-1 estimate at your 24.0% rate — not tax advice; consult a CPA.
Schools (NCES district)
- District
- Atlanta Public Schools
- NCES district ID
- 1300120
- Math proficiency
- 28% ▼ -6.00%
- Reading proficiency
- 35% ▼ -2.00%
- Median HH income
- $48,306
- Composite
- 27.27/100
- National rank
- #7006
- State rank
- #80 of 174 in GA
Livability — Atlanta
- Score
- 83/100
- State rank
- #6
- US rank
- #919
Category grades
Schools grade is shown separately in the Schools card above.
Census & demographics
- Census place
- Atlanta, GA
- County
- Fulton County · 1,094,430 people
- City population
- 629,525
- Metro
- Atlanta-Sandy Springs-Alpharetta, GA
- Population (ZIP)
- 34,264
- Household income
- $50,822
- Rent vs Own
- Severe rent burden
- 2962.0
Population outlook (Fulton County) Hauer SSP2
- Today (2025)
- 1,203,707 people
- By 2030
- 1,299,706 · +8.0%
- By 2040
- 1,488,256 · +23.6%
- By 2050
- 1,664,580 · +38.3%
- By 2075
- 2,036,072 · +69.2%
- By 2100
- 2,222,402 · +84.6%
Race, ethnicity, and origin ACS 2023
- Neighborhood character
- Predominantly Black (72%)
- Race & ethnicity
- Black 72% White 14% Hispanic / Latino 10% Two or more races 4%
- Hispanic origin (detail)
- Mexican 4%
- Common ancestry
- Romanian 1% Italian 1% Lithuanian 1%
- Foreign-born
- 5% · Canada
- Languages at home
- 90% English-only · Spanish 9% French/Haitian/Cajun 1%
Political lean MEDSL · Fulton
- 2024 margin
- Solid D (+44.9) · D 71.9% · R 27.0% · Other 1.1%
- 2008→2024 swing
- +9.8pp toward D · 2008: 35.0pp · 2024: 44.9pp
- All cycles
- 2024: D+44.9 2020: D+46.4 2016: D+42.1 2012: D+29.6 2008: D+35.0
Not yet ingested
- Civics
- —
Market trends
- HPI YoY
- ▼ -281.87%
- Current HPI
- 176.673
- Rent YoY
- ▲ 3.23%
- Metro
- Atlanta-Sandy Springs-Alpharetta, GA
- State GDP YoY
- ▲ 2.66%
- F500 in state
- 28
Industry mix (Fortune 500 HQ in GA)
| Industry | F500 HQs | Revenue |
|---|---|---|
| Paper / Packaging | 2 | $29B |
|
||
| Retail | 1 | $160B |
|
||
| Transportation / Logistics | 1 | $91B |
|
||
| Airlines | 1 | $62B |
|
||
| Consumer Goods | 1 | $47B |
|
||
| Utilities | 1 | $25B |
|
||
Price history
+906.6% since first listed7 events — show timeline
- 2026-06-17 Listed $182,198 FMLS
- 2026-06-17 Listed $182,198 GAMLS
- 2019-08-21 Sold (Public Records) $81,000 Public Records
- 2009-03-26 Sold (MLS) $14,000 FMLS
- 2009-02-05 Listed $13,900 FMLS
- 2007-06-07 Sold (Public Records) $135,000 Public Records
- 1979-02-27 Sold (Public Records) $18,100 Public Records
Property tax history
+7.5%/yrLatest (2025): $3,746 · -11.6% YoY. Source: county tax records.
Cash-flow waterfall
monthlySold comps — $/sqft
last 12 mo · ≤1 miLoading sold comps…