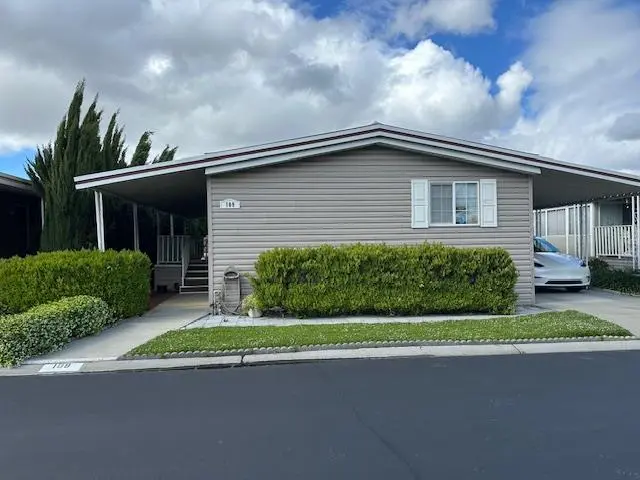
625 Hillsdale Ave #109
San Jose, CA 95136
$359,900C+
3 bd · 2.0 ba ·
1,440 sqft ·
Built 1976
· Manufactured
· Active
· 60 DOM
Cashflow @ list (25.0% down · 7.5%)
Estimated rent
$4,025/mo
Mortgage (P&I)
−$1,887
Tax + insurance
−$668
HOA
−$0
Vac / Maint / Mgmt
−$845
Net cashflow
$625/mo
Annual
$7,497/yr
Cap rate
8.60%
Cash-on-cash
8.25%
DSCR
1.37
1% rule
1.12%
Cash to close
$100,772
Investor read
- This is a 3-bed/2.0-bath manufactured listed at $360k. Condition is rated good.
- At list price, monthly cash flow is $625 ($7k/yr) — positive.
- The deal already cash-flows at list — no discount required.
- Meets the 1% rule at list price ($4k rent vs $360k).
- It's been on market 60 days — a 3% lower offer ($349k) is reasonable based on typical stale-listing flexibility.
- Recommended offer: $349k (3.0% below list) — sets the bar for market timing.
- Local home prices are declining (-3.0%/yr); year-one equity from $2k of loan paydown is wiped out by about $11k of value loss. Plan a longer hold.
- Location reads 78/100 on livability (#68 in CA, #2,559 nationally) — a middle-class / working-renter tenant base. Strengths: amenities A+, commute A+, employment A+; Watch: crime F, cost of living F.
- East Side Union High (urban): math 53% / reading 70% proficiency, ranked #69 of 517 in CA (top 13%) — acceptable for families but not a draw, mixed tenant base, ~2y average lease.
- Zoned schools: Shirakawa (George Sr.) Elementary (633 students, 49% FRL); Bridges Academy (287 students, 72% FRL); Evergreen Valley High (math 76% / reading 83%, grade A-, #45 of 1,170 statewide, top 4%, 2,767 students, 13% FRL).
- Zoned-school proficiency averages 80% at this address vs 62% district-wide (+18 pts) — the actual schools serving this property are materially stronger than the East Side Union High average implies; a family-tenant draw the district grade alone would hide.
- Watch-outs: flood insurance adds $68/mo.
- Market conditions: Rents rising (+3.4%/yr); 91 active listings in the ZIP; 31 comparable units currently listed for rent nearby; rentals leasing fast (median 1d on market — plan ~1-2 weeks tenant-placement turnaround); high-income renter base; 3,838 units permitted in Santa Clara County in 2024 (1,886 in 5+ unit buildings).
- Santa Clara County population projected at +24% by 2050 — long-run rental-demand tailwind backs the buy-and-hold thesis.
- 4 sale attempts with the ask held roughly flat each time — persistent listings suggest the price (not the market) is what's stuck; bring a comps-based counter.
- Climate carrying-cost: severe flood risk; extreme-heat days projected 7→14/yr by 2055 (HVAC capex compounding) — expect insurance premiums to compound above CPI over the hold.
- Cap rate 8.6% vs local median 1.6% in San Jose — top-decile yield for the area; either an underpriced asset or a hidden risk that comps aren't pricing in. Stress-test before assuming the spread holds.
- This rent runs 34% of the median local income ($142k/yr) — at the standard rent-burdened threshold; future hikes will face affordability resistance.
Questions for listing agent
- It's been on market 60 days. Have you received any prior offers? Is the seller open to a 3% concession, seller financing, or rate buy-down credit?
- Built in 1976 — when were the roof, HVAC, electrical panel, plumbing, and water heater last replaced?
- What's the actual annual flood-insurance premium (NFIP or private), and is the property in a SFHA with mandatory coverage?
- Is there a deadline driving the sale (1031 exchange, divorce, estate, relocation)? That informs how much negotiation room exists.
- Crime grade is F in this area — have there been break-ins, vandalism, or insurance claims at this property in the last 3 years? What carrier currently insures it and at what premium?
- What's the average days-on-market for RENTAL listings here right now (not sales)? A rising rental-DOM trend means longer vacancies and softer asking-rent achievability than the comps imply.
- What's the recent tenant-quality profile in this submarket — average credit score on applications, eviction rate, late-payment / NSF rate, and stable-employment percentage? A property-management company in the area should have these aggregated.
- How much new for-sale + rental construction is in the pipeline within 1–3 miles? Heavy new supply typically softens prices + rents 12–24 months out; constrained supply supports both.
CashFlowRE · CFR-0C5BR79K946B4E
· Data 1 day ago
cashflowre.app · 2026-05-29