625 Hillsdale Ave #109 · San Jose, CA
Flood risk 8/10 · Major
- FEMA flood zone
- D
- Chance of flooding over 30 yrs
- 0.99%
- Est. flood insurance / yr
- $544 – $1,084
Fire risk 1/10 · Minimal
- Est. fire insurance / yr
- $659 – $1,223
Heat risk 5/10 · Moderate
- Hot days now (above 94°F)
- 7 days/yr
- Hot days in 30 yrs
- 14 days/yr
Wind risk 1/10 · Minimal
- Chance of severe wind over 30 yrs
- —
Air-quality risk 9/10 · Severe
- Unhealthy air days now
- 17 days/yr
- Unhealthy air days in 30 yrs
- 17 days/yr
Risk factors via First Street. Map © Google.
Why this score? — see what drove the C+ grade
The composite is a weighted blend of 9 inputs, each scored 0–100. Each bar is that input's sub-score; the figure is the points it added to the 100-point composite (weight × sub-score).
- Cash flow +23.8/30.0
- DSCR +7.7/10.0
- ARV discount +7.2/15.0
- 1% rule +6.2/10.0
- Schools +5.5/10.0
- Condition / age +4.0/5.0
- Livability +3.9/5.0
- Rent growth +3.3/5.0
- Appreciation +0.0/10.0
$359,900
🖨 Deal sheet (PDF) 📄 Offer letter ✓ Due diligence
Listing remarks MLS
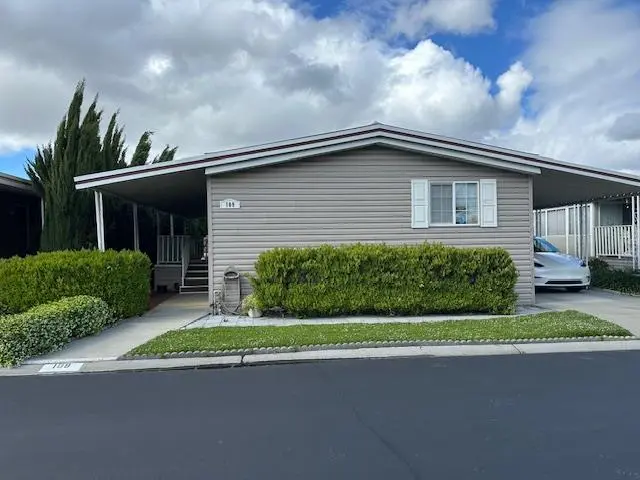
Move right in to this updated home in the highly desirable 55+ age-restricted Mountain Springs mobile home community. The home features three bedrooms and two bathrooms. All bedrooms feature walk-in closets. Mountain Springs is situated close to the light rail station, Home Depot, grocery stores, banks, Starbucks and many restaurants. You will love living here. The home has low space rent of $1026/month.
Key facts
- Light rail station
- Grocery stores
- Walk-in closets
Tags
Neighborhood map
What this means for you Summary
Snapshot
- This is a 3-bed/2.0-bath manufactured listed at $360k. Condition is rated good.
Deal economics
- At list price, monthly cash flow is $625 ($7k/yr) — positive.
- The deal already cash-flows at list — no discount required.
- Meets the 1% rule at list price ($4k rent vs $360k).
- Recommended offer: $349k (3.0% below list) — sets the bar for market timing.
- Cap rate 8.6% vs local median 1.6% in San Jose — top-decile yield for the area; either an underpriced asset or a hidden risk that comps aren't pricing in. Stress-test before assuming the spread holds.
Location & tenants
- Location reads 78/100 on livability (#68 in CA, #2,559 nationally) — a middle-class / working-renter tenant base. Strengths: amenities A+, commute A+, employment A+; Watch: crime F, cost of living F.
- East Side Union High (urban): math 53% / reading 70% proficiency, ranked #69 of 517 in CA (top 13%) — acceptable for families but not a draw, mixed tenant base, ~2y average lease.
- Zoned schools: Shirakawa (George Sr.) Elementary (633 students, 49% FRL); Bridges Academy (287 students, 72% FRL); Evergreen Valley High (math 76% / reading 83%, grade A-, #45 of 1,170 statewide, top 4%, 2,767 students, 13% FRL).
- Zoned-school proficiency averages 80% at this address vs 62% district-wide (+18 pts) — the actual schools serving this property are materially stronger than the East Side Union High average implies; a family-tenant draw the district grade alone would hide.
- Market conditions: Rents rising (+3.4%/yr); 91 active listings in the ZIP; 31 comparable units currently listed for rent nearby; rentals leasing fast (median 1d on market — plan ~1-2 weeks tenant-placement turnaround); high-income renter base; 3,838 units permitted in Santa Clara County in 2024 (1,886 in 5+ unit buildings).
- This rent runs 34% of the median local income ($142k/yr) — at the standard rent-burdened threshold; future hikes will face affordability resistance.
Forward outlook
- Local home prices are declining (-3.0%/yr); year-one equity from $2k of loan paydown is wiped out by about $11k of value loss. Plan a longer hold.
- Santa Clara County population projected at +24% by 2050 — long-run rental-demand tailwind backs the buy-and-hold thesis.
Negotiation context
- It's been on market 60 days — a 3% lower offer ($349k) is reasonable based on typical stale-listing flexibility.
- 4 sale attempts with the ask held roughly flat each time — persistent listings suggest the price (not the market) is what's stuck; bring a comps-based counter.
Risks & watch-outs
- Watch-outs: flood insurance adds $68/mo.
- Climate carrying-cost: severe flood risk; extreme-heat days projected 7→14/yr by 2055 (HVAC capex compounding) — expect insurance premiums to compound above CPI over the hold.
Questions for the listing agent
- It's been on market 60 days. Have you received any prior offers? Is the seller open to a 3% concession, seller financing, or rate buy-down credit?
- Built in 1976 — when were the roof, HVAC, electrical panel, plumbing, and water heater last replaced?
- What's the actual annual flood-insurance premium (NFIP or private), and is the property in a SFHA with mandatory coverage?
- Is there a deadline driving the sale (1031 exchange, divorce, estate, relocation)? That informs how much negotiation room exists.
- Crime grade is F in this area — have there been break-ins, vandalism, or insurance claims at this property in the last 3 years? What carrier currently insures it and at what premium?
- What's the average days-on-market for RENTAL listings here right now (not sales)? A rising rental-DOM trend means longer vacancies and softer asking-rent achievability than the comps imply.
- What's the recent tenant-quality profile in this submarket — average credit score on applications, eviction rate, late-payment / NSF rate, and stable-employment percentage? A property-management company in the area should have these aggregated.
- How much new for-sale + rental construction is in the pipeline within 1–3 miles? Heavy new supply typically softens prices + rents 12–24 months out; constrained supply supports both.
Investment metrics
- 1% rule
- 1.12% ✓
- Cap rate
- 8.60%
- Cash-on-cash
- 8.25%
- DSCR
- 1.37
- GRM
- 7.5
CMA / ARV
- ARV (median comp)
- $357,170
- List price
- $359,900
- Delta
- 0.76%
- Verdict
- FAIR
- Comps
- 20 within 1.0 mi
Show comp detail 12 sales within ~0.75 mi
| Address | Dist | Beds/Ba | Sqft | Sold | Price | $/sf | Match |
|---|---|---|---|---|---|---|---|
| 120 Mountain Spgs #120 | 0.07mi | 2/2.0 (-1) | 1,440 (0%) | 4mo | $225,000 | $156 | 88 |
| 126 Mountain Springs Dr #126 | 0.12mi | 2/2.0 (-1) | 1,440 (0%) | 2mo | $350,000 | $243 | 88 |
| 146 Mountain Springs Dr #146 | 0.10mi | 2/2.0 (-1) | 1,440 (0%) | 6mo | $325,000 | $226 | 85 |
| 242 Mountain Springs Dr #242 | 0.17mi | 3/2.0 | 1,488 (+3%) | 3mo | $444,950 | $299 | 84 |
| 3300 Narvaez Ave #175 | 0.21mi | 3/2.0 | 1,490 (+4%) | 1mo | $325,000 | $218 | 83 |
| 149 Mountain Springs Dr #149 | 0.12mi | 2/2.0 (-1) | 1,440 (0%) | 8mo | $220,000 | $153 | 82 |
| 236 Mountain Springs Dr #236 | 0.21mi | 3/2.0 | 1,488 (+3%) | 10mo | $450,000 | $302 | 76 |
| 255 Mountain Springs Dr #255 | 0.17mi | 3/2.0 | 1,584 (+10%) | 3mo | $525,000 | $331 | 73 |
| 543 Mountain Home Dr #543 | 0.15mi | 2/2.0 (-1) | 1,536 (+7%) | 7mo | $419,000 | $273 | 71 |
| 547 Mountain Home Dr #68 | 0.13mi | 3/3.0 | 1,560 (+8%) | 8mo | $455,000 | $292 | 69 |
| 3300 Narvaez Ave #53 | 0.26mi | 3/2.0 | 1,617 (+12%) | 11mo | $370,000 | $229 | 58 |
| 3637 Snell Ave #12 | 0.74mi | 3/2.0 | 1,440 (0%) | 9mo | $353,000 | $245 | 58 |
Match score weights: distance 35% · size 25% · config 20% · recency 20%. Top-matched comps best support the ARV.
Projected returns pro-forma
-3.0% appreciation · 3.36% rent growth · sell at horizon
- IRR
- -4.5%
- Equity multiple
- 0.83×
- Total profit
- $-16,973
- Equity at exit
- $53,662
- IRR
- 5.6%
- Equity multiple
- 1.43×
- Total profit
- $42,908
- Equity at exit
- $31,118
Cash invested: $100,772 (down + closing). Projections, not guarantees.
Landlord ↔ Tenant lean methodology
- Overall (CITY)
- 0 Strongly Tenant-Friendly
- State California
- 18 Strongly Tenant-Friendly · D+13
- County
- — inherits STATE
- City San Jose
- 0 Strongly Tenant-Friendly · D+24
ZIP-level market 95136
- Rents YoY
- 3.4%
- Active inventory
- 91
- Price-to-rent
- 7.5×
Monthly cashflow live
- Estimated rent
- $4,025 high interval (Pro) →
- Mortgage (P&I)
- −$1,887
- Tax est. 1.5%
- −$450 /mo · $5,398/yr
- Insurance
- −$150
- Flood insurance flood zone
- −$68 /mo · $814/yr
- HOA
- −$0
- Vacancy / Maint / Mgmt
- −$845
- Net cashflow
- $625
Break-even live
Sensitivity live
| Price | -10% $873 | -5% $749 | +0% $625 | +5% $500 | +10% $376 |
|---|---|---|---|---|---|
| Rent | -10% $307 | -5% $466 | +0% $625 | +5% $784 | +10% $943 |
| Rate | -1.0pp $806 | -0.5pp $716 | base $625 | +0.5pp $531 | +1.0pp $436 |
UW: 25.0% down · 7.5% · 30yr · 1.5% tax · 5.0% vac · 8.0% maint · 8.0% mgmt
Financing live
Cash to close
- Down payment
- $89,975
- Closing costs
- $10,797
- Reserves months
- —
- Total cash needed
- —
Loan-product check · same deal, 3 products live
Conventional
25% down · 7.5% · 30yr
- Down + closing
- —
- Monthly P&I
- —
- Monthly cashflow
- —
- DSCR
- —
- Eligible?
- —
Personal DTI + credit; lowest rate.
DSCR
20% down · 8.5% · 30yr
- Down + closing
- —
- Monthly P&I
- —
- Monthly cashflow
- —
- DSCR
- —
- Eligible?
- —
No personal income docs; deal must DSCR.
Hard money
10% down · 12.0% · 12mo
- Down + closing
- —
- Monthly P&I
- —
- Monthly cashflow
- —
- DSCR
- —
- Eligible?
- —
Short-term bridge; refi at stabilization.
Rent comps 31 comps
| Address | Beds | Baths | Sqft | Rent | $/sqft | DOM | Units | Dist |
|---|---|---|---|---|---|---|---|---|
| 3157 Regency Ave #612 San Jose, CA | 2.0 | 2.5 | 1282 | $4,195 | $3.27 | 3d | 1 | 0.22mi |
| 3158 Regency Ave San Jose, CA | 2.0 | 2.5 | 1257 | $3,695 | $2.94 | 0d | 1 | 0.24mi |
| 2988 Grassina St #309 San Jose, CA | 2.0 | 2.0 | 1048 | $3,600 | $3.44 | 3d | 1 | 0.38mi |
| 318 Araglin Ct San Jose, CA | 2.0 | 2.0 | 1168 | $3,300 | $2.83 | 4d | 1 | 0.40mi |
| 2070 Mary Helen Ln San Jose, CA | 3.0 | 4.0 | 1781 | $4,495 | $2.52 | 0d | 1 | 0.47mi |
| 3601 Copperfield Dr San Jose, CA | 1.0–3.0 | 1.0–3.0 | 1088 | $4,571 | $4.20 | 0d | 24 | 0.51mi |
| 2986 Lina St #7 San Jose, CA | 3.0 | 3.0 | 1813 | $5,500 | $3.03 | 18d | 1 | 0.52mi |
| 3200 Rubino Dr San Jose, CA | 1.0–2.0 | 1.0–2.0 | 928 | $3,725 | $4.01 | 0d | 1 | 0.65mi |
| 778 Bend Ave San Jose, CA | 3.0 | 2.0 | 1688 | $4,375 | $2.59 | 45d | 1 | 0.72mi |
| 818 Foxworthy Ave San Jose, CA | 3.0 | 2.5 | 1589 | $4,700 | $2.96 | 19d | 1 | 0.76mi |
| 818 Foxworthy Ave San Jose, CA | 3.0 | 2.5 | 1589 | $4,700 | $2.96 | 21d | 1 | 0.76mi |
| 3024 Goodacre Pl San Jose, CA | 3.0 | 2.5 | 1431 | $2,200 | $1.54 | 45d | 1 | 0.78mi |
| 3115 Tuscolana Way #1595 San Jose, CA | 3.0 | 2.5 | 1580 | $4,430 | $2.80 | 18d | 1 | 0.85mi |
| 4162 Wessex Dr Unit Na San Jose, CA | 3.0 | 2.0 | 1200 | $4,250 | $3.54 | 22d | 1 | 0.86mi |
| 45 Esfahan Dr San Jose, CA | 3.0 | 2.5 | 1794 | $4,395 | $2.45 | 0d | 1 | 0.98mi |
| 244 Vista Roma Way San Jose, CA | 4.0 | 2.5 | 1800 | $4,400 | $2.44 | 0d | 1 | 0.98mi |
| 4000 Ellmar Oaks Dr San Jose, CA | 1.0–3.0 | 1.0–2.0 | 876 | $4,677 | $5.34 | 0d | 31 | 1.03mi |
| 1277 Babb Ct San Jose, CA | 2.0 | 2.0 | 1123 | $3,550 | $3.16 | 0d | 2 | 1.04mi |
| 861 Branham Ln Unit 3 San Jose, CA | 2.0 | 1.5 | 1100 | $2,700 | $2.45 | 16d | 1 | 1.08mi |
| 3129 Kenland Dr San Jose, CA | 3.0 | 2.0 | 1094 | $3,450 | $3.15 | 0d | 1 | 1.13mi |
| 287 Kenbrook Cir San Jose, CA | 2.0 | 2.0 | 1012 | $2,795 | $2.76 | 0d | 1 | 1.14mi |
| 4647 Powderborn Ct San Jose, CA | 3.0 | 2.5 | 1496 | $3,795 | $2.54 | 45d | 1 | 1.17mi |
| 334 Olive Hill Dr San Jose, CA | 2.0 | 3.0 | 1368 | $4,150 | $3.03 | 0d | 1 | 1.17mi |
| 262 Azevedo Cir #1603 San Jose, CA | 3.0 | 3.0 | 1620 | $3,720 | $2.30 | 0d | 1 | 1.21mi |
| 200 Lewis Rd San Jose, CA | 1.0–3.0 | 1.0–2.0 | 867 | $2,821 | $3.25 | 0d | 1 | 1.25mi |
| 4778 Eagle Lake Dr San Jose, CA | 3.0 | 2.0 | 1508 | $4,595 | $3.05 | 0d | 1 | 1.29mi |
| 2212 Almaden Rd Unit B San Jose, CA | 2.0 | 2.0 | 1200 | $3,195 | $2.66 | 5d | 1 | 1.30mi |
| 1036 Cumberland Pl San Jose, CA | 2.0 | 2.0 | 1264 | $5,375 | $4.25 | 45d | 1 | 1.33mi |
| 4300 The Woods Dr San Jose, CA | 3.0 | 1.0–3.5 | 918 | $4,099 | $4.47 | 0d | 1 | 1.38mi |
| 559 Manor Dr Unit NA San Jose, CA | 2.0 | 1.5 | 1200 | $3,300 | $2.75 | 45d | 1 | 1.42mi |
| 167 Rancho Manor Ct San Jose, CA | 2.0 | 3.0 | 950 | $3,150 | $3.32 | 0d | 1 | 1.43mi |
Listing history 21 events
-
2026-06-21days on market $359,900 Active 60 DOM
-
2026-06-18days on market $359,900 Active 57 DOM
-
2026-06-17days on market $359,900 Active 56 DOM
-
2026-06-16days on market $359,900 Active 55 DOM
-
2026-06-15days on market $359,900 Active 54 DOM
-
2026-06-13days on market $359,900 Active 52 DOM
-
2026-06-13days on market $359,900 Active 51 DOM
-
2026-06-09days on market $359,900 Active 48 DOM
-
2026-06-08days on market $359,900 Active 47 DOM
-
2026-06-07days on market $359,900 Active 46 DOM
-
2026-06-05days on market $359,900 Active 43 DOM
-
2026-06-03days on market $359,900 Active 42 DOM
-
2026-06-02days on market $359,900 Active 41 DOM
-
2026-06-01days on market $359,900 Active 40 DOM
-
2026-05-31days on market $359,900 Active 39 DOM
-
2026-04-24status Active 407-char remark
Show marketing remark (407 chars)
Move right in to this updated home in the highly desirable 55+ age-restricted Mountain Springs mobile home community. The home features three bedrooms and two bathrooms. All bedrooms feature walk-in closets. Mountain Springs is situated close to the light rail station, Home Depot, grocery stores, banks, Starbucks and many restaurants. You will love living here. The home has low space rent of $1026/month.
-
2026-04-23status Active 407-char remark
Show marketing remark (407 chars)
Move right in to this updated home in the highly desirable 55+ age-restricted Mountain Springs mobile home community. The home features three bedrooms and two bathrooms. All bedrooms feature walk-in closets. Mountain Springs is situated close to the light rail station, Home Depot, grocery stores, banks, Starbucks and many restaurants. You will love living here. The home has low space rent of $1026/month.
-
2026-04-16historical 407-char remark
Show marketing remark (407 chars)
Move right in to this updated home in the highly desirable 55+ age-restricted Mountain Springs mobile home community. The home features three bedrooms and two bathrooms. All bedrooms feature walk-in closets. Mountain Springs is situated close to the light rail station, Home Depot, grocery stores, banks, Starbucks and many restaurants. You will love living here. The home has low space rent of $1026/month.
-
2026-04-15$359,900 Active 407-char remark
Show marketing remark (407 chars)
Move right in to this updated home in the highly desirable 55+ age-restricted Mountain Springs mobile home community. The home features three bedrooms and two bathrooms. All bedrooms feature walk-in closets. Mountain Springs is situated close to the light rail station, Home Depot, grocery stores, banks, Starbucks and many restaurants. You will love living here. The home has low space rent of $1026/month.
ⓘ Source: listings_history table (triggers on properties + properties_extension) + one-shot
backfill from property_details.listing_events for pre-trigger history.
Climate risk First Street
- Flood 8/10 Severe FEMA zone D · 99% chance over 30 yrs
- Wildfire 1/10 Low
- Heat 5/10 Major 7 d/yr ≥94°F today · 14 d/yr by 30 yrs out
- Wind 1/10 Low
- Air quality 9/10 Extreme 17 unhealthy d/yr today · 17 by 30 yrs out
Nearby sold comps map
Loading sold comps map…
Walkable amenities ~0.75 mi
Loading nearby amenities…
Taxation est. · year 1
- Rental income
- $48,298
- − Mortgage interest
- −$20,160
- − Property taxes
- −$5,398
- − Insurance
- −$2,614
- − Repairs & maintenance
- −$3,864
- − Management
- −$3,864
- − Depreciation
- −$10,470
- Taxable income
- $1,928
- Est. tax owed @ 24.0%
- −$463
- After-tax cash flow
- $7,032/yr
For passive investors: Depreciation is non-cash, so a rental often shows a tax loss while cash-flowing — sheltering income. Rental losses are passive: they offset passive income freely, and up to $25,000/yr can offset ordinary (W-2) income if you actively participate and your MAGI is under $100k (phasing out to $0 by $150k); unused losses carry forward. On sale, claimed depreciation is recaptured at up to 25%, and gains may owe capital-gains tax (a 1031 exchange can defer both). Figures are a year-1 estimate at your 24.0% rate — not tax advice; consult a CPA.
Condition & rehab AI · 1 photo
This updated mobile home in a desirable community is in good condition with minor cosmetic improvements needed to enhance its curb appeal and value.
Value-add opportunities
- Both Paint exterior siding — Fresh paint can enhance curb appeal and value.
- Both Trim and hedge maintenance — Well-maintained landscaping can improve curb appeal and attract potential buyers/tenants.
Renovation cost estimate screening
Value-add ROI direction
- Both Paint exterior siding — Fresh paint can enhance curb appeal and value. ↑
- Both Trim and hedge maintenance — Well-maintained landscaping can improve curb appeal and attract potential buyers/tenants. ↑
ⓘ Cost ranges are severity-bucket heuristics (US national rule-of-thumb). Get contractor quotes + a written scope before underwriting a rehab budget.
Schools (NCES district)
- District
- East Side Union High
- NCES district ID
- 0611820
- Math proficiency
- 53% ▲ 12.00%
- Reading proficiency
- 70% ▲ 8.00%
- Median HH income
- $80,293
- Composite
- 55.15/100
- National rank
- #1278
- State rank
- #69 of 517 in CA
Livability — San Jose
- Score
- 78/100
- State rank
- #68
- US rank
- #2559
Category grades
Schools grade is shown separately in the Schools card above.
Census & demographics
- Census place
- San Jose, CA
- County
- Santa Clara County · 1,806,974 people
- City population
- 954,479
- Metro
- San Jose-Sunnyvale-Santa Clara, CA
- Population (ZIP)
- 48,056
- Household income
- $142,433
- Rent vs Own
- Severe rent burden
- 1653.0
Population outlook (Santa Clara County) Hauer SSP2
- Today (2025)
- 2,179,074 people
- By 2030
- 2,301,297 · +5.6%
- By 2040
- 2,528,195 · +16.0%
- By 2050
- 2,712,135 · +24.5%
- By 2075
- 2,998,701 · +37.6%
- By 2100
- 2,931,429 · +34.5%
Race, ethnicity, and origin ACS 2023
- Neighborhood character
- Highly diverse neighborhood (Simpson 0.72)
- Race & ethnicity
- Asian 36% White 29% Hispanic / Latino 26% Two or more races 15% Black 4%
- Hispanic origin (detail)
- Mexican 20%
- Common ancestry
- Scotch-Irish 1% Lithuanian 1% Russian 1%
- Foreign-born
- 38% · Vietnam, Canada, China
- Languages at home
- 47% English-only · Spanish 16% Vietnamese 12% Other Indo-European 7%
Political lean MEDSL · Santa Clara
- 2024 margin
- Solid D (+40.0) · D 68.1% · R 28.1% · Other 3.8%
- 2008→2024 swing
- -0.9pp no change · 2008: 40.9pp · 2024: 40.0pp
- All cycles
- 2024: D+40.0 2020: D+47.4 2016: D+52.5 2012: D+42.1 2008: D+40.9
Not yet ingested
- Civics
- —
Market trends
- HPI YoY
- ▼ -1427.80%
- Current HPI
- 336.6634
- Rent YoY
- ▲ 3.36%
- Metro
- San Jose-Sunnyvale-Santa Clara, CA
- State GDP YoY
- ▲ 3.21%
- F500 in state
- 116
Industry mix (Fortune 500 HQ in CA)
| Industry | F500 HQs | Revenue |
|---|---|---|
| Technology | 27 | $1,492B |
|
||
| Financial Services | 3 | $174B |
|
||
| Retail | 3 | $44B |
|
||
| Insurance | 3 | $26B |
|
||
| Media / Entertainment | 2 | $115B |
|
||
| Pharmaceuticals / Biotech | 2 | $62B |
|
||
Price history
+0.0% since first listed6 events — show timeline
- 2026-04-24 Relisted — bridgeMLS, Bay East AOR, or Contra Costa AOR
- 2026-04-23 Relisted — MLSListings
- 2026-04-16 Listing Removed — bridgeMLS, Bay East AOR, or Contra Costa AOR
- 2026-04-16 Listing Removed — MLSListings
- 2026-04-15 Listed $359,900 MLSListings
- 2026-04-15 Listed $359,900 bridgeMLS, Bay East AOR, or Contra Costa AOR
Cash-flow waterfall
monthlySold comps — $/sqft
last 12 mo · ≤1 miLoading sold comps…