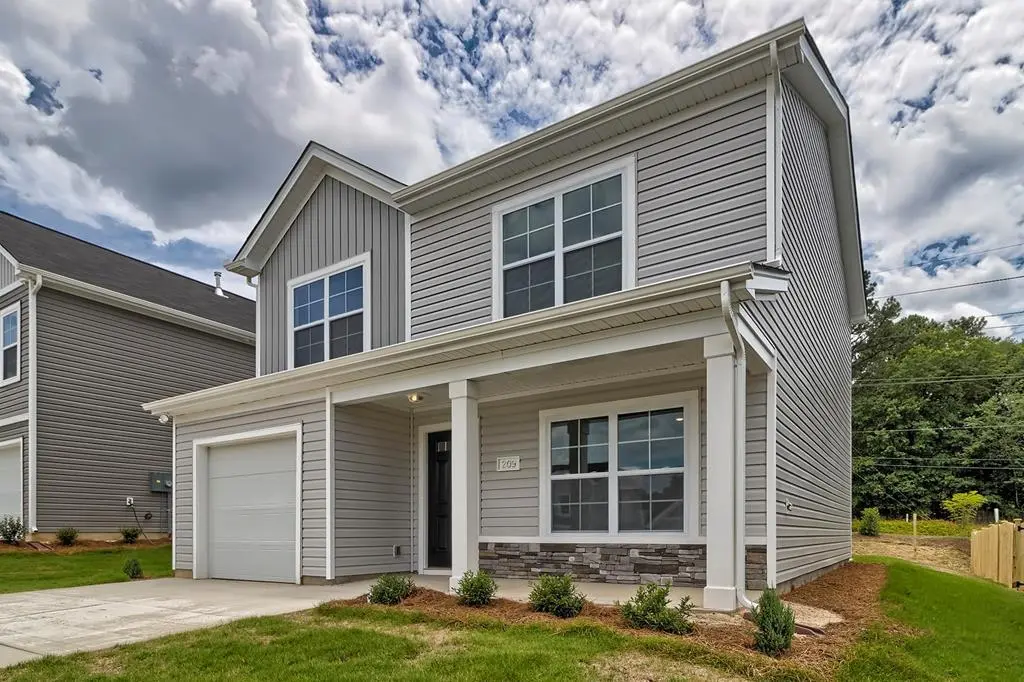
604 Marbled Teal Ln
Winnsboro, SC 29061
$219,900D
3 bd · 2.5 ba ·
1,404 sqft ·
Built 2023
· SingleFamily
· Pending
· 7 DOM
Cashflow @ list (25.0% down · 7.5%)
Estimated rent
$2,001/mo
Mortgage (P&I)
−$1,153
Tax + insurance
−$366
HOA
−$28
Vac / Maint / Mgmt
−$420
Net cashflow
$33/mo
Annual
$394/yr
Cap rate
6.47%
Cash-on-cash
0.64%
DSCR
1.03
1% rule
0.91%
Cash to close
$61,572
Investor read
- This is a 3-bed/2.5-bath single-family listed at $220k.
- At list price, monthly cash flow is $33 ($394/yr) — positive.
- The deal already cash-flows at list — no discount required.
- To meet the 1% rule (rent ≥ 1% of price), the offer needs to be $200k (9.0% below list).
- Only 7 days on market — expect competitive offers; lowballing is unlikely to land.
- Recommended offer: $200k (9.0% below list) — sets the bar for 1% rule.
- Local home prices are declining (-3.0%/yr); year-one equity from $2k of loan paydown is wiped out by about $7k of value loss. Plan a longer hold.
- Location reads 54/100 on livability (#320 in SC) — a working-class tenant base; expect higher turnover. Strengths: cost of living A+; Watch: housing D, amenities F, commute F.
- Fairfield 01 (rural): math 26% / reading 38% proficiency, ranked #53 of 80 in SC (top 66%) — families likely to look elsewhere, expect single-tenant / working-renter base with shorter leases; 80% free/reduced lunch — lower-income household profile, screen leases tightly.
- Zoned schools: Fairfield Elementary (math 16% / reading 17%, grade F, #535 of 597 statewide, top 90%, 463 students, 100% FRL); Fairfield Middle (math 17% / reading 29%, grade F, #171 of 229 statewide, top 76%, 337 students, 100% FRL); Fairfield Central High (math 37% / reading 77%, grade C, #120 of 196 statewide, top 64%, 662 students, 100% FRL) — zoned schools average 100% FRL vs 80% district-wide (20 pts higher); higher-poverty schools than district average — tighter screening recommended.
- Market conditions: 335 active listings in the ZIP; 91 units permitted in Fairfield County in 2024 (0 in 5+ unit buildings).
- Fairfield County population projected at -32% by 2050 — secular population decline; favor cash flow + early exit over multi-decade hold.
- 2 sale attempts since 3y ago with the ask held roughly flat each time — persistent listings suggest the price (not the market) is what's stuck; bring a comps-based counter.
- Climate carrying-cost: major wind risk, 44% chance of damaging wind over 30y; extreme-heat days projected 7→16/yr by 2055 (HVAC capex compounding) — expect insurance premiums to compound above CPI over the hold.
- This rent runs 40% of the median local income ($60k/yr) — at the standard rent-burdened threshold; future hikes will face affordability resistance.
Questions for listing agent
- What does the HOA fee cover, when was the last increase, and are there any pending special assessments or reserve-fund shortfalls?
- Is there a deadline driving the sale (1031 exchange, divorce, estate, relocation)? That informs how much negotiation room exists.
- Schools are F-rated, which usually means shorter tenancies and higher turnover. Who's the typical renter profile here, and what's been the actual vacancy rate?
- The area grade is low — what's the realistic commute time and amenity access for the typical tenant pool here? Any planned neighborhood developments (good or bad) we should know about?
- What's the average days-on-market for RENTAL listings here right now (not sales)? A rising rental-DOM trend means longer vacancies and softer asking-rent achievability than the comps imply.
- What's the recent tenant-quality profile in this submarket — average credit score on applications, eviction rate, late-payment / NSF rate, and stable-employment percentage? A property-management company in the area should have these aggregated.
- How much new for-sale + rental construction is in the pipeline within 1–3 miles? Heavy new supply typically softens prices + rents 12–24 months out; constrained supply supports both.
CashFlowRE · CFR-0CKCD2FSB49VKN
· Data 3 weeks ago
cashflowre.app · 2026-05-29