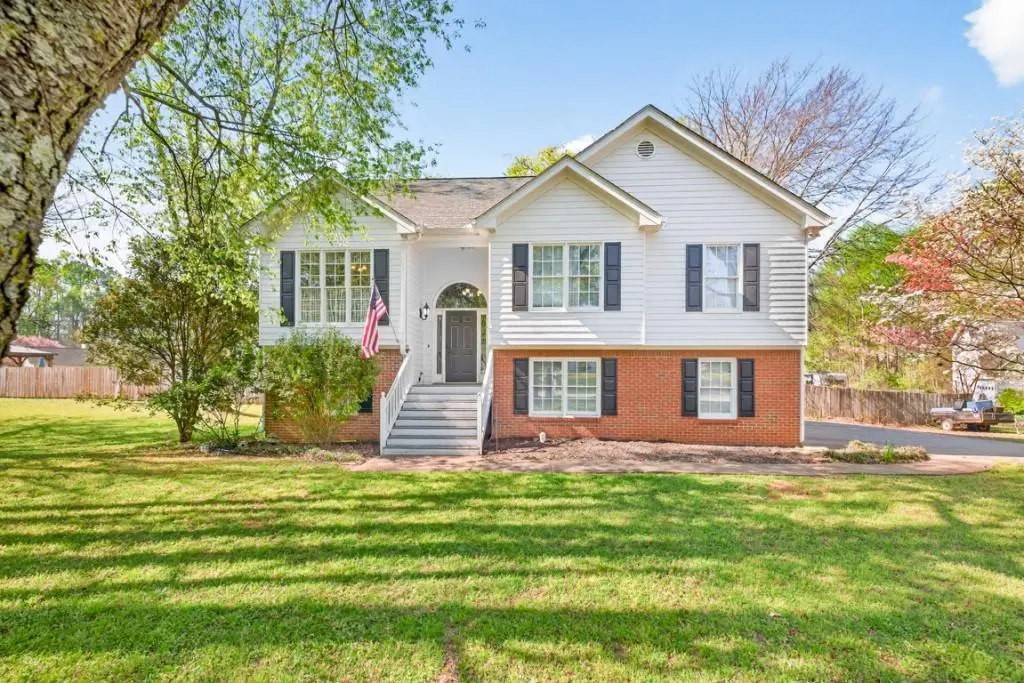
69 Siding Ln
Jefferson, GA 30549
$399,900D-
4 bd · 2.0 ba ·
2,322 sqft ·
Built 1997
· SingleFamily
· Pending
· 55 DOM
Cashflow @ list (25.0% down · 7.5%)
Estimated rent
$2,491/mo
Mortgage (P&I)
−$2,097
Tax + insurance
−$386
HOA
−$0
Vac / Maint / Mgmt
−$523
Net cashflow
$-515/mo
Annual
$-6,176/yr
Cap rate
4.75%
Cash-on-cash
-5.52%
DSCR
0.75
1% rule
0.62%
Cash to close
$111,972
Investor read
- This is a 4-bed/2.0-bath single-family listed at $400k.
- At list price, monthly cash flow is $-515 ($-6k/yr) — negative.
- To cash-flow at today's rent, offer at most $309k (22.7% below list).
- To meet the 1% rule (rent ≥ 1% of price), the offer needs to be $249k (37.7% below list).
- It's been on market 55 days — a 3% lower offer ($388k) is reasonable based on typical stale-listing flexibility.
- Recommended offer: $249k (37.7% below list) — sets the bar for 1% rule.
- Local home prices are declining (-3.0%/yr); year-one equity from $3k of loan paydown is wiped out by about $12k of value loss. Plan a longer hold.
- Location reads 74/100 on livability (#40 in GA, #4,690 nationally) — a middle-class / working-renter tenant base. Strengths: crime A+, housing A+, employment A; Watch: amenities F, commute F.
- Jefferson City (town): math 73% / reading 65% proficiency, ranked #4 of 174 in GA (top 2%) — acceptable for families but not a draw, mixed tenant base, ~2y average lease.
- Market conditions: Rents rising fast (+7.5%/yr); 570 active listings in the ZIP; 3 comparable units currently listed for rent nearby; rentals lingering (median 44d on market — plan ~5-8 weeks vacancy on turnover, expect pricing pressure); 67% of comp listings sitting > 30 days — soft ceiling on asking rent; solid renter incomes; 2,167 units permitted in Jackson County in 2024 (59 in 5+ unit buildings).
- Jackson County population projected at +14% by 2050 — modest demand growth; plan on rents tracking national, not racing it.
- 4 sale attempts with the ask held roughly flat each time — persistent listings suggest the price (not the market) is what's stuck; bring a comps-based counter.
- Current owner paid $126k; list at $400k implies a 216% gain — meaningful room to come down on a strong offer.
- Climate carrying-cost: extreme-heat days projected 7→17/yr by 2055 (HVAC capex compounding) — expect insurance premiums to compound above CPI over the hold.
- Cap rate 4.7% vs local median 3.1% in Jefferson — top-decile yield for the area; either an underpriced asset or a hidden risk that comps aren't pricing in. Stress-test before assuming the spread holds.
- This rent runs 31% of the median local income ($96k/yr) — at the standard rent-burdened threshold; future hikes will face affordability resistance.
Questions for listing agent
- What do current leases actually rent for vs. the listed asking? Can we see a recent rent roll and the last 12 months of T-12 income?
- It's been on market 55 days. Have you received any prior offers? Is the seller open to a 38% concession, seller financing, or rate buy-down credit?
- Is there a deadline driving the sale (1031 exchange, divorce, estate, relocation)? That informs how much negotiation room exists.
- The area grade is low — what's the realistic commute time and amenity access for the typical tenant pool here? Any planned neighborhood developments (good or bad) we should know about?
- What's the average days-on-market for RENTAL listings here right now (not sales)? A rising rental-DOM trend means longer vacancies and softer asking-rent achievability than the comps imply.
- What's the recent tenant-quality profile in this submarket — average credit score on applications, eviction rate, late-payment / NSF rate, and stable-employment percentage? A property-management company in the area should have these aggregated.
- How much new for-sale + rental construction is in the pipeline within 1–3 miles? Heavy new supply typically softens prices + rents 12–24 months out; constrained supply supports both.
CashFlowRE · CFR-0FBV2F5M39QB79
· Data 3 weeks ago
cashflowre.app · 2026-05-29