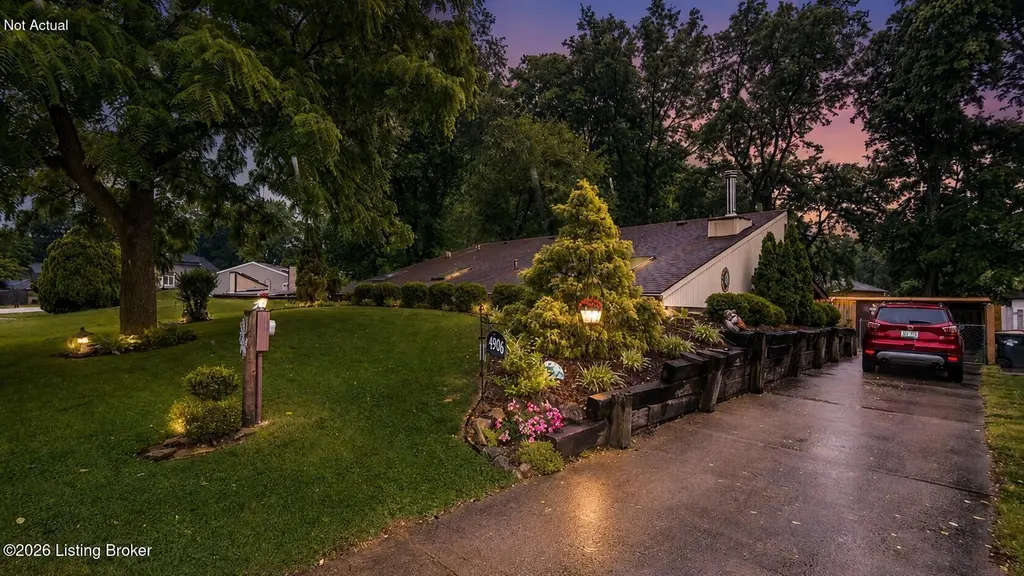
4906 Roman Dr
Jeffersontown, KY 40291
$269,900D
3 bd · 2.0 ba ·
1,600 sqft ·
Built 1983
· SingleFamily
· Pending
· 1 DOM
Cashflow @ list (25.0% down · 7.5%)
Estimated rent
$2,139/mo
Mortgage (P&I)
−$1,415
Tax + insurance
−$272
HOA
−$0
Vac / Maint / Mgmt
−$449
Net cashflow
$2/mo
Annual
$29/yr
Cap rate
6.30%
Cash-on-cash
0.04%
DSCR
1.00
1% rule
0.79%
Cash to close
$75,572
Investor read
- This is a 3-bed/2.0-bath single-family listed at $270k.
- At list price, monthly cash flow is $2 ($29/yr) — positive.
- The deal already cash-flows at list — no discount required.
- To meet the 1% rule (rent ≥ 1% of price), the offer needs to be $214k (20.8% below list).
- Only 1 days on market — expect competitive offers; lowballing is unlikely to land.
- Recommended offer: $214k (20.8% below list) — sets the bar for 1% rule.
- Local home prices are declining (-3.0%/yr); year-one equity from $2k of loan paydown is wiped out by about $8k of value loss. Plan a longer hold.
- Location reads 81/100 on livability (#68 in KY, #1,520 nationally) — a professional / high-income tenant draw. Strengths: commute A+, cost of living A+, housing A+; Watch: health & safety D+, amenities F.
- Jefferson County (urban): math 19% / reading 35% proficiency, ranked #121 of 165 in KY (top 73%) — low school quality limits family demand, transient renter base, plan for 1-2y turnover.
- Zoned schools: Watterson Elementary (math 8% / reading 17%, grade F, #630 of 676 statewide, top 95%, 494 students, 70% FRL); Ramsey Middle (math 11% / reading 34%, grade F, #200 of 217 statewide, top 93%, 1,008 students, 62% FRL); Fern Creek High (math 20% / reading 27%, grade F, #199 of 254 statewide, top 78%, 1,688 students, 60% FRL).
- Market conditions: Rents rising fast (+15.0%/yr); 294 active listings in the ZIP; 8 comparable units currently listed for rent nearby; rentals at typical pace (median 18d on market — plan ~3-4 weeks tenant-placement turnaround); solid renter incomes; 2,836 units permitted in Jefferson County in 2024 (1,558 in 5+ unit buildings).
- Jefferson County population projected at +13% by 2050 — modest demand growth; plan on rents tracking national, not racing it.
- 7 sale attempts since 19y ago with the ask held roughly flat each time — persistent listings suggest the price (not the market) is what's stuck; bring a comps-based counter.
- Current owner paid $138k; list at $270k implies a 96% gain — meaningful room to come down on a strong offer.
- Climate carrying-cost: extreme-heat days projected 7→20/yr by 2055 (HVAC capex compounding) — expect insurance premiums to compound above CPI over the hold.
- Cap rate 6.3% vs local median 4.2% in Jeffersontown — top-decile yield for the area; either an underpriced asset or a hidden risk that comps aren't pricing in. Stress-test before assuming the spread holds.
- This rent runs 32% of the median local income ($81k/yr) — at the standard rent-burdened threshold; future hikes will face affordability resistance.
Questions for listing agent
- Is there a deadline driving the sale (1031 exchange, divorce, estate, relocation)? That informs how much negotiation room exists.
- The area grade is low — what's the realistic commute time and amenity access for the typical tenant pool here? Any planned neighborhood developments (good or bad) we should know about?
- What's the average days-on-market for RENTAL listings here right now (not sales)? A rising rental-DOM trend means longer vacancies and softer asking-rent achievability than the comps imply.
- What's the recent tenant-quality profile in this submarket — average credit score on applications, eviction rate, late-payment / NSF rate, and stable-employment percentage? A property-management company in the area should have these aggregated.
- How much new for-sale + rental construction is in the pipeline within 1–3 miles? Heavy new supply typically softens prices + rents 12–24 months out; constrained supply supports both.
CashFlowRE · CFR-0FD2KJBQHCTJE3
· Data 2 weeks ago
cashflowre.app · 2026-05-29