4906 Roman Dr · Jeffersontown, KY
Flood risk 1/10 · Minimal
- FEMA flood zone
- X (unshaded)
- Chance of flooding over 30 yrs
- 0.0%
- Est. flood insurance / yr
- $507 – $1,088
Fire risk 1/10 · Minimal
- Est. fire insurance / yr
- $839 – $1,559
Heat risk 5/10 · Moderate
- Hot days now (above 104°F)
- 7 days/yr
- Hot days in 30 yrs
- 20 days/yr
Wind risk 2/10 · Minimal
- Chance of severe wind over 30 yrs
- 3.0%
Air-quality risk 3/10 · Minor
- Unhealthy air days now
- 2 days/yr
- Unhealthy air days in 30 yrs
- 5 days/yr
Risk factors via First Street. Map © Google.
Why this score? — see what drove the D grade
The composite is a weighted blend of 9 inputs, each scored 0–100. Each bar is that input's sub-score; the figure is the points it added to the 100-point composite (weight × sub-score).
- Cash flow +13.3/30.0
- ARV discount +9.1/15.0
- Rent growth +5.0/5.0
- DSCR +4.0/10.0
- Livability +4.0/5.0
- 1% rule +2.9/10.0
- Condition / age +2.5/5.0
- Schools +2.3/10.0
- Appreciation +0.0/10.0
$269,900
🖨 Deal sheet (PDF) 📄 Offer letter ✓ Due diligence
Listing remarks MLS
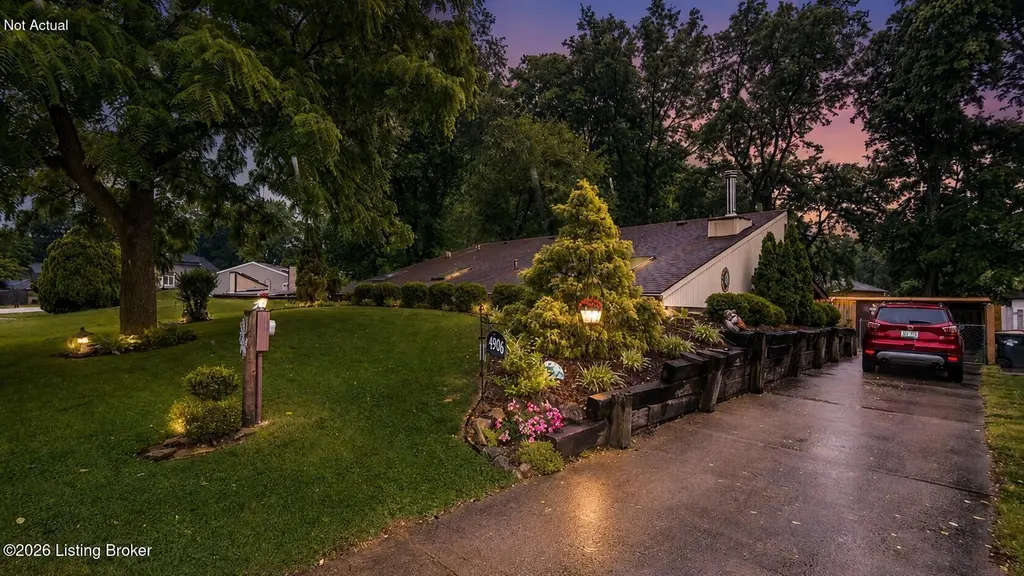
1980’s meets the 21st century with this fabulous renovated “BERM HOUSE”! A berm house is an earth-sheltered building where the soil or substrate is “thermally significant” making function contribution to the thermal effectiveness of your home…to you this means your LG&E bills yearlong will average about $50 a month!! (not bad for 1600+- sq ft) Yet it is bermed in the front, you still have nice oversized windows in the back for natural lighting plus new skylights! Plus a HUGE covered outdoor area and private backyard. Located in the convenient Stonybrook area yet tucked away on a quiet street. If you are looking for a unique opportunity to purchase one of the most energy efficient homes in Louisville now is your chance. This home has been totally updated...watch out, you might just think it's new! If features todays modern colors and finishes and a stainless steel kitchen. The great room features a beautiful stone wall and wood burning fireplace. All the bedrooms are generous size and there are two bathroom. All this for just $150,000! Call today for a private showing! IMMEDIATE POSSESSION OFFERED.
Key facts
- 9,810 sq ft lot
- Garage
- Built 1983
Property features AI
Finance
- Other: Subdivision: NOTTINGHAM HILLS
- HOA & community: No association fee
Exterior
- Parking: Detached garage with driveway and front entry
- Utilities: Electricity connected; Natural gas
- Home design: Single-family residence (Berm architectural style); One-story home; Entry from the front
- Construction: Built in 1983; Vinyl siding; Shingle roof; Slab / poured concrete foundation
- Exterior features: Level lot; Privacy, full wood and chain-link fencing
Interior
- Kitchen: Eat-in kitchen on the first floor
- Bedrooms: 3 bedrooms total, all on the first floor; Primary bedroom on the first floor with primary bathroom
- Bathrooms: 2 full bathrooms, including a primary (both on the first floor)
- Heating & cooling: Natural gas heating; Central air conditioning; One HVAC unit
- Interior features: One fireplace in the living area; Total of 6 rooms (8 rooms listed in some sources); 6 closets; No basement
- Laundry & utility: First-floor laundry
Neighborhood map
What this means for you Summary
Snapshot
- This is a 3-bed/2.0-bath single-family listed at $270k.
Deal economics
- At list price, monthly cash flow is $2 ($29/yr) — positive.
- The deal already cash-flows at list — no discount required.
- To meet the 1% rule (rent ≥ 1% of price), the offer needs to be $214k (20.8% below list).
- Recommended offer: $214k (20.8% below list) — sets the bar for 1% rule.
- Cap rate 6.3% vs local median 4.2% in Jeffersontown — top-decile yield for the area; either an underpriced asset or a hidden risk that comps aren't pricing in. Stress-test before assuming the spread holds.
Location & tenants
- Location reads 81/100 on livability (#68 in KY, #1,520 nationally) — a professional / high-income tenant draw. Strengths: commute A+, cost of living A+, housing A+; Watch: health & safety D+, amenities F.
- Jefferson County (urban): math 19% / reading 35% proficiency, ranked #121 of 165 in KY (top 73%) — low school quality limits family demand, transient renter base, plan for 1-2y turnover.
- Zoned schools: Watterson Elementary (math 8% / reading 17%, grade F, #630 of 676 statewide, top 95%, 494 students, 70% FRL); Ramsey Middle (math 11% / reading 34%, grade F, #200 of 217 statewide, top 93%, 1,008 students, 62% FRL); Fern Creek High (math 20% / reading 27%, grade F, #199 of 254 statewide, top 78%, 1,688 students, 60% FRL).
- Market conditions: Rents rising fast (+15.0%/yr); 294 active listings in the ZIP; 8 comparable units currently listed for rent nearby; rentals at typical pace (median 18d on market — plan ~3-4 weeks tenant-placement turnaround); solid renter incomes; 2,836 units permitted in Jefferson County in 2024 (1,558 in 5+ unit buildings).
- This rent runs 32% of the median local income ($81k/yr) — at the standard rent-burdened threshold; future hikes will face affordability resistance.
Forward outlook
- Local home prices are declining (-3.0%/yr); year-one equity from $2k of loan paydown is wiped out by about $8k of value loss. Plan a longer hold.
- Jefferson County population projected at +13% by 2050 — modest demand growth; plan on rents tracking national, not racing it.
Negotiation context
- Only 1 days on market — expect competitive offers; lowballing is unlikely to land.
- 7 sale attempts since 19y ago with the ask held roughly flat each time — persistent listings suggest the price (not the market) is what's stuck; bring a comps-based counter.
- Current owner paid $138k; list at $270k implies a 96% gain — meaningful room to come down on a strong offer.
Risks & watch-outs
- Climate carrying-cost: extreme-heat days projected 7→20/yr by 2055 (HVAC capex compounding) — expect insurance premiums to compound above CPI over the hold.
Questions for the listing agent
- Is there a deadline driving the sale (1031 exchange, divorce, estate, relocation)? That informs how much negotiation room exists.
- The area grade is low — what's the realistic commute time and amenity access for the typical tenant pool here? Any planned neighborhood developments (good or bad) we should know about?
- What's the average days-on-market for RENTAL listings here right now (not sales)? A rising rental-DOM trend means longer vacancies and softer asking-rent achievability than the comps imply.
- What's the recent tenant-quality profile in this submarket — average credit score on applications, eviction rate, late-payment / NSF rate, and stable-employment percentage? A property-management company in the area should have these aggregated.
- How much new for-sale + rental construction is in the pipeline within 1–3 miles? Heavy new supply typically softens prices + rents 12–24 months out; constrained supply supports both.
Investment metrics
- 1% rule
- 0.79% ✗
- Cap rate
- 6.30%
- Cash-on-cash
- 0.04%
- DSCR
- 1.00
- GRM
- 10.5
CMA / ARV
- ARV (on-the-fly)
- $280,000
- Comps found
- 12
Show comp detail 12 sales within ~0.75 mi
| Address | Dist | Beds/Ba | Sqft | Sold | Price | $/sf | Match |
|---|---|---|---|---|---|---|---|
| 8609 Michael Edward Dr | 0.12mi | 3/2.0 | 1,708 (+7%) | 8mo | $210,000 | $123 | 76 |
| 8807 Roman Ct | 0.08mi | 3/2.0 | 1,734 (+8%) | 8mo | $260,000 | $150 | 76 |
| 4816 Ferrer Way | 0.47mi | 3/1.5 | 1,550 (-3%) | 1mo | $250,000 | $161 | 70 |
| 8808 Michael Edward Dr | 0.25mi | 3/1.0 | 1,491 (-7%) | 4mo | $265,000 | $178 | 70 |
| 8712 Hudson Ln | 0.36mi | 3/2.0 | 1,512 (-6%) | 7mo | $265,000 | $175 | 68 |
| 4417 Lochridge Pkwy | 0.48mi | 3/2.0 | 1,675 (+5%) | 3mo | $395,000 | $236 | 67 |
| 4429 Lochridge Pkwy | 0.49mi | 3/2.0 | 1,675 (+5%) | 7mo | $395,400 | $236 | 64 |
| 8607 Laverne Dr | 0.12mi | 4/2.0 (+1) | 1,799 (+12%) | 9mo | $290,000 | $161 | 62 |
| 4706 Clarmar Rd | 0.52mi | 3/3.0 | 1,667 (+4%) | 8mo | $300,000 | $180 | 58 |
| 4724 Ferrer Way | 0.54mi | 4/2.0 (+1) | 1,471 (-8%) | 4mo | $290,000 | $197 | 53 |
| 4403 Pebblewood Ct | 0.57mi | 4/2.5 (+1) | 1,698 (+6%) | 8mo | $275,000 | $162 | 50 |
| 4804 Mike Ct | 0.53mi | 3/2.5 | 1,820 (+14%) | 10mo | $275,000 | $151 | 42 |
Match score weights: distance 35% · size 25% · config 20% · recency 20%. Top-matched comps best support the ARV.
Projected returns pro-forma
-3.0% appreciation · 8.0% rent growth · sell at horizon
- IRR
- -11.3%
- Equity multiple
- 0.57×
- Total profit
- $-32,356
- Equity at exit
- $40,243
- IRR
- 3.5%
- Equity multiple
- 1.31×
- Total profit
- $23,149
- Equity at exit
- $23,336
Cash invested: $75,572 (down + closing). Projections, not guarantees.
Landlord ↔ Tenant lean methodology
- Overall (STATE)
- 83 Strongly Landlord-Friendly
- State Kentucky
- 83 Strongly Landlord-Friendly · R+16
- County
- — inherits STATE
- City
- — inherits STATE
ZIP-level market 40291
- Rents YoY
- 15.0%
- Active inventory
- 294
- Price-to-rent
- 10.5×
Monthly cashflow live
- Estimated rent
- $2,139 high interval (Pro) →
- Mortgage (P&I)
- −$1,415
- Tax from tax record
- −$159 /mo · $1,910/yr
- Insurance
- −$112
- HOA
- −$0
- Vacancy / Maint / Mgmt
- −$449
- Net cashflow
- $2
Break-even live
Sensitivity live
| Price | -10% $155 | -5% $79 | +0% $2 | +5% $-74 | +10% $-150 |
|---|---|---|---|---|---|
| Rent | -10% $-167 | -5% $-82 | +0% $2 | +5% $87 | +10% $171 |
| Rate | -1.0pp $138 | -0.5pp $71 | base $2 | +0.5pp $-68 | +1.0pp $-139 |
UW: 25.0% down · 7.5% · 30yr · 1.5% tax · 5.0% vac · 8.0% maint · 8.0% mgmt
Financing live
Cash to close
- Down payment
- $67,475
- Closing costs
- $8,097
- Reserves months
- —
- Total cash needed
- —
Loan-product check · same deal, 3 products live
Conventional
25% down · 7.5% · 30yr
- Down + closing
- —
- Monthly P&I
- —
- Monthly cashflow
- —
- DSCR
- —
- Eligible?
- —
Personal DTI + credit; lowest rate.
DSCR
20% down · 8.5% · 30yr
- Down + closing
- —
- Monthly P&I
- —
- Monthly cashflow
- —
- DSCR
- —
- Eligible?
- —
No personal income docs; deal must DSCR.
Hard money
10% down · 12.0% · 12mo
- Down + closing
- —
- Monthly P&I
- —
- Monthly cashflow
- —
- DSCR
- —
- Eligible?
- —
Short-term bridge; refi at stabilization.
Rent comps 8 comps
| Address | Beds | Baths | Sqft | Rent | $/sqft | DOM | Units | Dist |
|---|---|---|---|---|---|---|---|---|
| 5115 Stony Brook Dr Louisville, KY | 3.0 | 3.0 | 2186 | $2,400 | $1.10 | 25d | 1 | 0.28mi |
| 9106 Talitha Dr Louisville, KY | 3.0 | 2.0 | 1414 | $2,035 | $1.44 | 13d | 1 | 0.58mi |
| 3805 Bigelow Dr Louisville, KY | 3.0 | 2.0 | 1674 | $2,100 | $1.25 | 25d | 1 | 1.25mi |
| 5124 Cynthia Dr Unit 5124 Louisville, KY | 2.0 | 2.0 | 1062 | $1,200 | $1.13 | 12d | 1 | 1.28mi |
| 3600 Ember Cir Louisville, KY | 4.0 | 1.5 | 1272 | $1,770 | $1.39 | 17d | 1 | 1.36mi |
| 7008 Wildwood Cir #60 Louisville, KY | 3.0 | 2.0 | 1250 | $1,299 | $1.04 | 5d | 1 | 1.38mi |
| 5705 Stone Bluff Rd Louisville, KY | 4.0 | 2.5 | 1800 | $2,300 | $1.28 | 23d | 1 | 1.46mi |
| 6306 Labor Ln Louisville, KY | 3.0 | 2.5 | 1880 | $1,999 | $1.06 | 17d | 1 | 1.47mi |
Listing history 16 events
-
2026-05-25$269,900 Active
-
2016-12-29soldstatus $137,500
-
2016-12-27soldstatus $137,500 Closed 1168-char remark
Show marketing remark (1168 chars)
1980’s meets the 21st century with this fabulous renovated “BERM HOUSE”! A berm house is an earth-sheltered building where the soil or substrate is “thermally significant” making function contribution to the thermal effectiveness of your home…to you this means your LG&E bills yearlong will average about $50 a month!! (not bad for 1600+- sq ft) Yet it is bermed in the front, you still have nice oversized windows in the back for natural lighting plus new skylights! Plus a HUGE covered outdoor area and private backyard. Located in the convenient Stonybrook area yet tucked away on a quiet street. If you are looking for a unique opportunity to purchase one of the most energy efficient homes in Louisville now is your chance. This home has been totally updated...watch out, you might just think it's new! If features todays modern colors and finishes and a stainless steel kitchen. The great room features a beautiful stone wall and wood burning fireplace. All the bedrooms are generous size and there are two bathroom. All this for just $150,000! Call today for a private showing! IMMEDIATE POSSESSION OFFERED.
-
2016-11-04status Pending 1168-char remark
Show marketing remark (1168 chars)
1980’s meets the 21st century with this fabulous renovated “BERM HOUSE”! A berm house is an earth-sheltered building where the soil or substrate is “thermally significant” making function contribution to the thermal effectiveness of your home…to you this means your LG&E bills yearlong will average about $50 a month!! (not bad for 1600+- sq ft) Yet it is bermed in the front, you still have nice oversized windows in the back for natural lighting plus new skylights! Plus a HUGE covered outdoor area and private backyard. Located in the convenient Stonybrook area yet tucked away on a quiet street. If you are looking for a unique opportunity to purchase one of the most energy efficient homes in Louisville now is your chance. This home has been totally updated...watch out, you might just think it's new! If features todays modern colors and finishes and a stainless steel kitchen. The great room features a beautiful stone wall and wood burning fireplace. All the bedrooms are generous size and there are two bathroom. All this for just $150,000! Call today for a private showing! IMMEDIATE POSSESSION OFFERED.
-
2016-10-06$150,000 Active 1168-char remark
Show marketing remark (1168 chars)
1980’s meets the 21st century with this fabulous renovated “BERM HOUSE”! A berm house is an earth-sheltered building where the soil or substrate is “thermally significant” making function contribution to the thermal effectiveness of your home…to you this means your LG&E bills yearlong will average about $50 a month!! (not bad for 1600+- sq ft) Yet it is bermed in the front, you still have nice oversized windows in the back for natural lighting plus new skylights! Plus a HUGE covered outdoor area and private backyard. Located in the convenient Stonybrook area yet tucked away on a quiet street. If you are looking for a unique opportunity to purchase one of the most energy efficient homes in Louisville now is your chance. This home has been totally updated...watch out, you might just think it's new! If features todays modern colors and finishes and a stainless steel kitchen. The great room features a beautiful stone wall and wood burning fireplace. All the bedrooms are generous size and there are two bathroom. All this for just $150,000! Call today for a private showing! IMMEDIATE POSSESSION OFFERED.
-
2015-05-06historical
-
2015-04-06status Active
-
2015-03-28historical
-
2015-03-05$123,900
-
2015-03-03historical
-
2014-06-23$123,900
-
2007-12-03soldstatus $113,675
-
2007-11-29soldstatus $113,675
-
2007-09-19$115,000
-
2007-09-14historical
-
2007-06-14$129,900
ⓘ Source: listings_history table (triggers on properties + properties_extension) + one-shot
backfill from property_details.listing_events for pre-trigger history.
Tax reassessment forecast KY · Resets to sale price
- Current annual tax
- $1,910 · $159/mo
- Projected year-2 tax
- $2,321 · $193/mo
- Expected delta
- +$411/yr (+$34/mo · 21.5%)
ⓘ Screening estimate from a state-policy table — verify with the county assessor before closing.
Climate risk First Street
- Flood 1/10 Low FEMA zone X (unshaded) · 0% chance over 30 yrs
- Wildfire 1/10 Low
- Heat 5/10 Major 7 d/yr ≥104°F today · 20 d/yr by 30 yrs out
- Wind 2/10 Low 3% chance of damaging wind over 30 yrs
- Air quality 3/10 Moderate 2 unhealthy d/yr today · 5 by 30 yrs out
Nearby sold comps map
Loading sold comps map…
Walkable amenities ~0.75 mi
Loading nearby amenities…
Taxation est. · year 1
- Rental income
- $25,662
- − Mortgage interest
- −$15,119
- − Property taxes
- −$1,910
- − Insurance
- −$1,350
- − Repairs & maintenance
- −$2,053
- − Management
- −$2,053
- − Depreciation
- −$7,852
- Taxable loss
- −$4,673
- Est. tax savings @ 24.0%
- +$1,122
- After-tax cash flow
- $1,151/yr
For passive investors: Depreciation is non-cash, so a rental often shows a tax loss while cash-flowing — sheltering income. Rental losses are passive: they offset passive income freely, and up to $25,000/yr can offset ordinary (W-2) income if you actively participate and your MAGI is under $100k (phasing out to $0 by $150k); unused losses carry forward. On sale, claimed depreciation is recaptured at up to 25%, and gains may owe capital-gains tax (a 1031 exchange can defer both). Figures are a year-1 estimate at your 24.0% rate — not tax advice; consult a CPA.
Schools (NCES district)
- District
- Jefferson County
- NCES district ID
- 2102990
- Math proficiency
- 19% ▼ -17.00%
- Reading proficiency
- 35% ▼ -11.00%
- Median HH income
- $47,885
- Composite
- 23.45/100
- National rank
- #7884
- State rank
- #121 of 165 in KY
Livability — Jeffersontown
- Score
- 81/100
- State rank
- #68
- US rank
- #1520
Category grades
Schools grade is shown separately in the Schools card above.
Census & demographics
- Census place
- Jeffersontown, KY
- County
- Jefferson County · 790,184 people
- Metro
- Louisville/Jefferson County, KY-IN
- Population (ZIP)
- 41,222
- Household income
- $81,267
- Rent vs Own
- Severe rent burden
- 790.0
Population outlook (Jefferson County) Hauer SSP2
- Today (2025)
- 823,112 people
- By 2030
- 849,343 · +3.2%
- By 2040
- 895,696 · +8.8%
- By 2050
- 933,630 · +13.4%
- By 2075
- 1,028,262 · +24.9%
- By 2100
- 1,072,675 · +30.3%
Race, ethnicity, and origin ACS 2023
- Neighborhood character
- Predominantly White (66%)
- Race & ethnicity
- White 66% Black 19% Two or more races 8% Hispanic / Latino 8% Asian 3%
- Hispanic origin (detail)
- Mexican 4%
- Common ancestry
- Italian 4% Slovak 3% Lithuanian 2%
- Foreign-born
- 7% · Canada, India, Vietnam
- Languages at home
- 89% English-only · Spanish 4% Russian/Polish/Slavic 1% French/Haitian/Cajun 1%
Political lean MEDSL · Jefferson
- 2024 margin
- D (+16.6) · D 57.4% · R 40.9% · Other 1.7%
- 2008→2024 swing
- +4.5pp toward D · 2008: 12.0pp · 2024: 16.6pp
- All cycles
- 2024: D+16.6 2020: D+20.1 2016: D+13.3 2012: D+11.1 2008: D+12.0
Not yet ingested
- Civics
- —
Market trends
- HPI YoY
- ▼ -279.15%
- Current HPI
- 218.0784
- Rent YoY
- ▲ 14.96%
- Metro
- Louisville/Jefferson County, KY-IN
- State GDP YoY
- ▲ 1.81%
- F500 in state
- 4
Industry mix (Fortune 500 HQ in KY)
| Industry | F500 HQs | Revenue |
|---|---|---|
| Healthcare | 1 | $118B |
|
||
| Food / Beverage | 1 | $7B |
|
||
Price history
+107.8% since first listed16 events — show timeline
- 2026-05-25 Listed $269,900 Metro Search MLS
- 2016-12-29 Sold (Public Records) $137,500 Public Records
- 2016-12-27 Sold (MLS) $137,500 Metro Search MLS
- 2016-11-04 Pending — Metro Search MLS
- 2016-10-06 Listed $150,000 Metro Search MLS
- 2015-05-06 Listing Removed — Metro Search MLS
- 2015-04-06 Relisted — Metro Search MLS
- 2015-03-28 Listing Removed — Metro Search MLS
- 2015-03-05 Listed $123,900 Metro Search MLS
- 2015-03-03 Listing Removed — Metro Search MLS
- 2014-06-23 Listed $123,900 Metro Search MLS
- 2007-12-03 Sold (Public Records) $113,675 Public Records
- 2007-11-29 Sold (MLS) $113,675 Metro Search MLS
- 2007-09-19 Listed $115,000 Metro Search MLS
- 2007-09-14 Listing Removed — Metro Search MLS
- 2007-06-14 Listed $129,900 Metro Search MLS
Property tax history
+4.3%/yrLatest (2025): $1,910 · -3.7% YoY. Source: county tax records.
Cash-flow waterfall
monthlySold comps — $/sqft
last 12 mo · ≤1 miLoading sold comps…