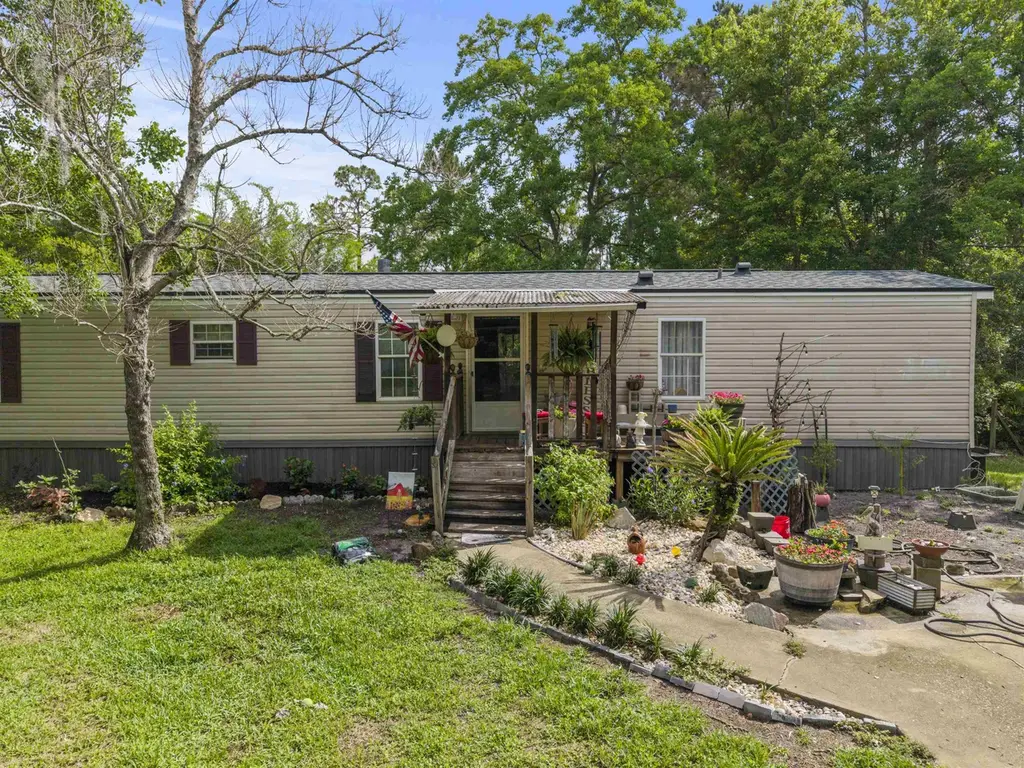
960 Cypress Rd
St. Augustine South, FL 32086
$190,000B
3 bd · 2.0 ba ·
1,216 sqft ·
Built 2000
· Manufactured
· Pending
· 3 DOM
Cashflow @ list (25.0% down · 7.5%)
Estimated rent
$2,106/mo
Mortgage (P&I)
−$996
Tax + insurance
−$213
HOA
−$0
Vac / Maint / Mgmt
−$442
Net cashflow
$455/mo
Annual
$5,459/yr
Cap rate
9.59%
Cash-on-cash
11.76%
DSCR
1.52
1% rule
1.11%
Cash to close
$53,200
Investor read
- This is a 3-bed/2.0-bath manufactured listed at $190k.
- At list price, monthly cash flow is $455 ($5k/yr) — positive.
- The deal already cash-flows at list — no discount required.
- Meets the 1% rule at list price ($2k rent vs $190k).
- Only 3 days on market — expect competitive offers; lowballing is unlikely to land.
- Local home prices are declining (-3.0%/yr); year-one equity from $1k of loan paydown is wiped out by about $6k of value loss. Plan a longer hold.
- Location reads: area grade B — affects rentability + tenant quality, not the cash-flow math above.
- St. Johns (rural): math 75% / reading 73% proficiency, ranked #2 of 73 in FL (top 3%) — strong family-tenant draw, lease renewals of 3-5y typical; only 20% free/reduced lunch — higher-income household profile.
- Zoned schools: Pedro Menendez High School (math 31% / reading 54%, grade F, #264 of 667 statewide, top 41%, 1,519 students, 39% FRL) — zoned schools average 39% FRL vs 20% district-wide (19 pts higher); higher-poverty schools than district average — tighter screening recommended.
- Zoned-school proficiency averages 42% at this address vs 74% district-wide (-32 pts) — the specific schools serving this property underperform the St. Johns average; the district grade overstates school quality for this exact location.
- Watch-outs: flood insurance adds $66/mo.
- Market conditions: Rents flat; 400 active listings in the ZIP; 15 comparable units currently listed for rent nearby; rentals at typical pace (median 21d on market — plan ~3-4 weeks tenant-placement turnaround); solid renter incomes; 5,575 units permitted in St. Johns County in 2024 (584 in 5+ unit buildings).
- St. Johns County population projected at +60% by 2050 — long-run rental-demand tailwind backs the buy-and-hold thesis.
- Climate carrying-cost: major flood risk; severe wind risk, 99% chance of damaging wind over 30y; moderate wildfire risk; extreme-heat days projected 7→20/yr by 2055 (HVAC capex compounding) — expect insurance premiums to compound above CPI over the hold.
- Cap rate 9.6% vs local median 4.1% in St. Augustine South — top-decile yield for the area; either an underpriced asset or a hidden risk that comps aren't pricing in. Stress-test before assuming the spread holds.
- This rent runs 33% of the median local income ($77k/yr) — at the standard rent-burdened threshold; future hikes will face affordability resistance.
Questions for listing agent
- What's the actual annual flood-insurance premium (NFIP or private), and is the property in a SFHA with mandatory coverage?
- Is there a deadline driving the sale (1031 exchange, divorce, estate, relocation)? That informs how much negotiation room exists.
- What's the average days-on-market for RENTAL listings here right now (not sales)? A rising rental-DOM trend means longer vacancies and softer asking-rent achievability than the comps imply.
- What's the recent tenant-quality profile in this submarket — average credit score on applications, eviction rate, late-payment / NSF rate, and stable-employment percentage? A property-management company in the area should have these aggregated.
- How much new for-sale + rental construction is in the pipeline within 1–3 miles? Heavy new supply typically softens prices + rents 12–24 months out; constrained supply supports both.
CashFlowRE · CFR-0FSFN7877HHCJ0
· Data 3 weeks ago
cashflowre.app · 2026-05-29