960 Cypress Rd · St. Augustine South, FL
Flood risk 7/10 · Major
- FEMA flood zone
- X (unshaded)
- Chance of flooding over 30 yrs
- 0.99%
- Est. flood insurance / yr
- $507 – $1,088
Fire risk 5/10 · Moderate
- Est. fire insurance / yr
- $947 – $1,759
Heat risk 9/10 · Severe
- Hot days now (above 106°F)
- 7 days/yr
- Hot days in 30 yrs
- 20 days/yr
Wind risk 9/10 · Severe
- Chance of severe wind over 30 yrs
- 99.0%
Air-quality risk 3/10 · Minor
- Unhealthy air days now
- 3 days/yr
- Unhealthy air days in 30 yrs
- 3 days/yr
Risk factors via First Street. Map © Google.
Why this score? — see what drove the B grade
The composite is a weighted blend of 9 inputs, each scored 0–100. Each bar is that input's sub-score; the figure is the points it added to the 100-point composite (weight × sub-score).
- Cash flow +26.8/30.0
- ARV discount +15.0/15.0
- DSCR +9.2/10.0
- Schools +6.4/10.0
- 1% rule +6.1/10.0
- Rent growth +2.7/5.0
- Livability +2.5/5.0
- Condition / age +2.5/5.0
- Appreciation +0.0/10.0
$190,000
🖨 Deal sheet 📄 Offer letter ✓ Due diligence
Listing remarks
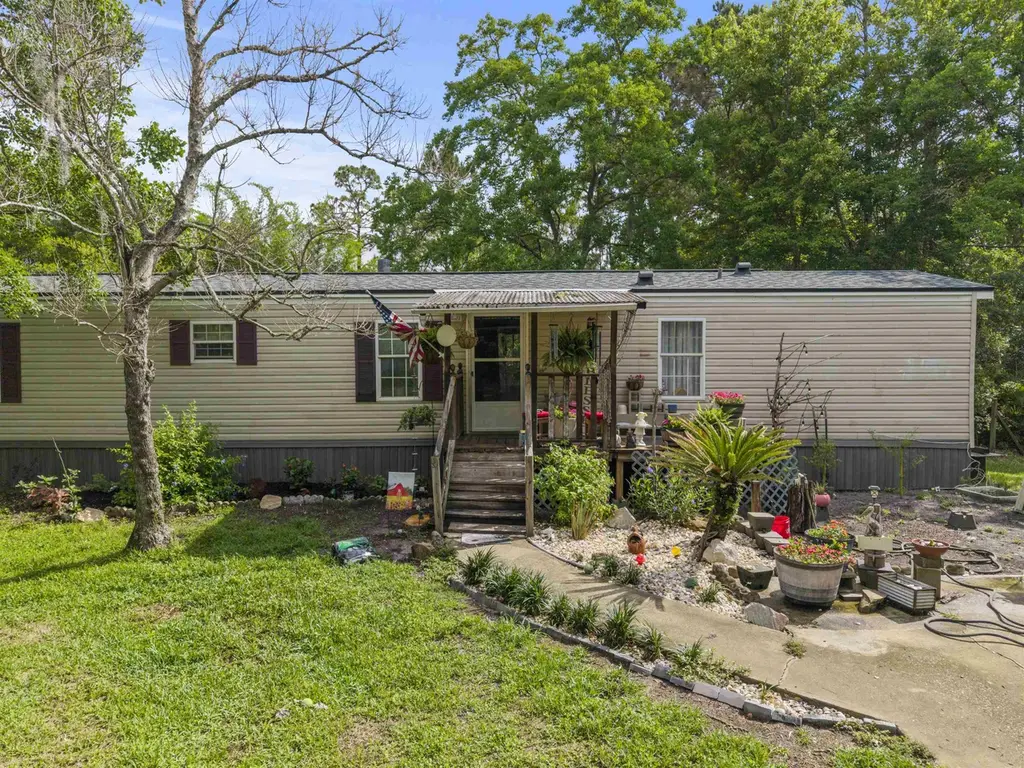
Affordable country charm with privacy, space, and unique extras all wrapped into one! Situated on 1.13 acres, this 3-bedroom, 2-bath single-wide manufactured home offers a cozy and inviting atmosphere with updates already in place and plenty of character throughout. Step inside to find laminate flooring throughout, an updated kitchen featuring beautiful cabinetry and warm wooden countertops, plus an updated living room centered around a charming wood-burning fireplace with an eye-catching stone accent wall — the perfect gathering space for family and friends. Washer and dryer are included for added convenience. Outside is where this property truly shines! Enjoy a fully fenced and very
Key facts
- Laminate flooring
- Updated kitchen
- Beautiful cabinetry
Tags
Property features AI
Finance
- Other: Property sits on about 1.13 acres (1+ acres)
Exterior
- Utilities: County water and well; Septic system
- Home design: Single-story (ground level) entry; Vinyl siding exterior; On-waterfront location (pond)
- Construction: Vinyl siding construction; Shingle roof; Crawl space foundation; skirted
- Exterior features: Fireplace; Full fenced yard; Pond on the property; Front porch approximately 13 x 6; Patio approximately 20 x 8
Interior
- Kitchen: Includes microwave, range, refrigerator; Kitchen roughly 15 x 9
- Bedrooms: Master bedroom approximately 14 x 11 (on ground level); Second bedroom approximately 14 x 9
- Flooring: Laminate wood
- Bathrooms: 2 bathrooms
- Heating & cooling: Central electric heating; Central electric air conditioning
- Interior features: Laminate wood flooring; Tub/shower combo in master bathroom
Neighborhood map
What this means for you Summary
Snapshot
- This is a 3-bed/2.0-bath manufactured listed at $190k.
Deal economics
- At list price, monthly cash flow is $455 ($5k/yr) — positive.
- The deal already cash-flows at list — no discount required.
- Meets the 1% rule at list price ($2k rent vs $190k).
- Cap rate 9.6% vs local median 4.1% in St. Augustine South — top-decile yield for the area; either an underpriced asset or a hidden risk that comps aren't pricing in. Stress-test before assuming the spread holds.
Location & tenants
- Location reads: area grade B — affects rentability + tenant quality, not the cash-flow math above.
- St. Johns (rural): math 75% / reading 73% proficiency, ranked #2 of 73 in FL (top 3%) — strong family-tenant draw, lease renewals of 3-5y typical; only 20% free/reduced lunch — higher-income household profile.
- Zoned schools: Pedro Menendez High School (math 31% / reading 54%, grade F, #264 of 667 statewide, top 41%, 1,519 students, 39% FRL) — zoned schools average 39% FRL vs 20% district-wide (19 pts higher); higher-poverty schools than district average — tighter screening recommended.
- Zoned-school proficiency averages 42% at this address vs 74% district-wide (-32 pts) — the specific schools serving this property underperform the St. Johns average; the district grade overstates school quality for this exact location.
- Market conditions: Rents flat; 400 active listings in the ZIP; 15 comparable units currently listed for rent nearby; rentals at typical pace (median 20d on market — plan ~3-4 weeks tenant-placement turnaround); solid renter incomes; 5,575 units permitted in St. Johns County in 2024 (584 in 5+ unit buildings).
- This rent runs 33% of the median local income ($77k/yr) — at the standard rent-burdened threshold; future hikes will face affordability resistance.
Forward outlook
- Local home prices are declining (-3.0%/yr); year-one equity from $1k of loan paydown is wiped out by about $6k of value loss. Plan a longer hold.
- St. Johns County population projected at +60% by 2050 — long-run rental-demand tailwind backs the buy-and-hold thesis.
Negotiation context
- Only 3 days on market — expect competitive offers; lowballing is unlikely to land.
Risks & watch-outs
- Watch-outs: flood insurance adds $66/mo.
- Climate carrying-cost: major flood risk; severe wind risk, 99% chance of damaging wind over 30y; moderate wildfire risk; extreme-heat days projected 7→20/yr by 2055 (HVAC capex compounding) — expect insurance premiums to compound above CPI over the hold.
Questions for the listing agent
- What's the actual annual flood-insurance premium (NFIP or private), and is the property in a SFHA with mandatory coverage?
- Is there a deadline driving the sale (1031 exchange, divorce, estate, relocation)? That informs how much negotiation room exists.
- What's the average days-on-market for RENTAL listings here right now (not sales)? A rising rental-DOM trend means longer vacancies and softer asking-rent achievability than the comps imply.
- What's the recent tenant-quality profile in this submarket — average credit score on applications, eviction rate, late-payment / NSF rate, and stable-employment percentage? A property-management company in the area should have these aggregated.
- How much new for-sale + rental construction is in the pipeline within 1–3 miles? Heavy new supply typically softens prices + rents 12–24 months out; constrained supply supports both.
Investment metrics
- 1% rule
- 1.11% ✓
- Cap rate
- 9.59%
- Cash-on-cash
- 11.76%
- DSCR
- 1.52
- GRM
- 7.5
CMA / ARV
- ARV (median comp)
- $248,475
- List price
- $190,000
- Delta
- -23.53%
- Verdict
- UNDERPRICED
- Comps
- 5 within 2.0 mi
Show comp detail 1 sale within ~0.75 mi
| Address | Dist | Beds/Ba | Sqft | Sold | Price | $/sf | Match |
|---|---|---|---|---|---|---|---|
| 2636 Juarez Ave | 0.21mi | 3/2.0 | 1,296 (+7%) | 10mo | $250,900 | $194 | 72 |
Match score weights: distance 35% · size 25% · config 20% · recency 20%. Top-matched comps best support the ARV.
Projected returns pro-forma
-3.0% appreciation · 0.85% rent growth · sell at horizon
- IRR
- -3.2%
- Equity multiple
- 0.88×
- Total profit
- $-6,305
- Equity at exit
- $28,330
- IRR
- 4.0%
- Equity multiple
- 1.27×
- Total profit
- $14,157
- Equity at exit
- $16,428
Cash invested: $53,200 (down + closing). Projections, not guarantees.
Landlord ↔ Tenant lean methodology
- Overall (STATE)
- 87 Strongly Landlord-Friendly
- State Florida
- 87 Strongly Landlord-Friendly · R+3
- County
- — inherits STATE
- City
- — inherits STATE
ZIP-level market 32086
- Rents YoY
- 0.8%
- Active inventory
- 400
- Price-to-rent
- 7.5×
Monthly cashflow live
- Estimated rent
- $2,106 high interval (Pro) →
- Mortgage (P&I)
- −$996
- Tax from tax record
- −$67 /mo · $805/yr
- Insurance
- −$79
- Flood insurance flood zone
- −$66 /mo · $798/yr
- HOA
- −$0
- Vacancy / Maint / Mgmt
- −$442
- Net cashflow
- $455
Break-even live
UW: 25.0% down · 7.5% · 30yr · 1.5% tax · 5.0% vac · 8.0% maint · 8.0% mgmt
Financing live
Cash to close
- Down payment
- $47,500
- Closing costs
- $5,700
- Reserves months
- —
- Total cash needed
- —
Loan-product check · same deal, 3 products live
Conventional
25% down · 7.5% · 30yr
- Down + closing
- —
- Monthly P&I
- —
- Monthly cashflow
- —
- DSCR
- —
- Eligible?
- —
Personal DTI + credit; lowest rate.
DSCR
20% down · 8.5% · 30yr
- Down + closing
- —
- Monthly P&I
- —
- Monthly cashflow
- —
- DSCR
- —
- Eligible?
- —
No personal income docs; deal must DSCR.
Hard money
10% down · 12.0% · 12mo
- Down + closing
- —
- Monthly P&I
- —
- Monthly cashflow
- —
- DSCR
- —
- Eligible?
- —
Short-term bridge; refi at stabilization.
Rent comps 15 comps
| Address | Beds | Baths | Sqft | Rent | $/sqft | DOM | Units | Dist |
|---|---|---|---|---|---|---|---|---|
| 890 Poinsettia Rd Unit B St. Augustine, FL | 2.0 | 2.0 | 1032 | $1,590 | $1.54 | 23d | 1 | 0.54mi |
| 421 S Hidden Tree Dr Saint Augustine, FL | 3.0 | 2.0 | 1344 | $2,100 | $1.56 | 23d | 1 | 0.77mi |
| 129 Moultrie Village Ln Saint Augustine, FL | 2.0 | 2.5 | 1384 | $1,750 | $1.26 | 20d | 1 | 0.79mi |
| 117 Ridge Lake Rd Saint Augustine, FL | 3.0 | 2.5 | 1471 | $2,200 | $1.50 | 7d | 1 | 0.86mi |
| 70 Ridge Lake Rd Saint Augustine, FL | 3.0 | 2.5 | 1470 | $2,025 | $1.38 | 23d | 1 | 0.87mi |
| 29 Buckley Ct Saint Augustine, FL | 2.0 | 2.5 | 1211 | $2,300 | $1.90 | 23d | 1 | 1.09mi |
| 105 Whitland Way Unit 1 St. Augustine, FL | 3.0 | 2.5 | 1499 | $2,300 | $1.53 | 3d | 1 | 1.11mi |
| 93 Palma Dr Saint Augustine, FL | 2.0–4.0 | 2.5 | 1506 | $2,272 | $1.51 | 3d | 18 | 1.14mi |
| 159 Beach Palm Ct Saint Augustine, FL | 3.0 | 2.5 | 1354 | $1,800 | $1.33 | 17d | 1 | 1.22mi |
| 350 Laurel Dr , FL | 1.0–3.0 | 1.0–2.0 | 1003 | $2,099 | $2.09 | 1d | 13 | 1.23mi |
| 113 Pamplona Dr Saint Augustine, FL | 2.0 | 2.5 | 1273 | $2,095 | $1.65 | 23d | 1 | 1.25mi |
| 150 Silver Fern Dr Saint Augustine, FL | 3.0 | 2.0 | 1354 | $1,900 | $1.40 | 21d | 1 | 1.31mi |
| 10 Moultrie Creek Cir Unit 1 St. Augustine, FL | 2.0 | 1.5 | 1078 | $1,700 | $1.58 | 23d | 1 | 1.33mi |
| 5 Moultrie Creek Cir Saint Augustine, FL | 2.0 | 1.5 | 1078 | $1,350 | $1.25 | 20d | 1 | 1.33mi |
| 97 Ayamonte Rd Saint Augustine, FL | 3.0 | 2.5 | 1308 | $1,775 | $1.36 | 16d | 1 | 1.48mi |
Listing history 1 events
-
2026-05-15$190,000 Active 924-char remark
ⓘ Source: listings_history table (triggers on properties + properties_extension) + one-shot
backfill from property_details.listing_events for pre-trigger history.
Tax reassessment forecast FL · Resets to sale price
- Current annual tax
- $805 · $67/mo
- Projected year-2 tax
- $1,577 · $131/mo
- Expected delta
- +$772/yr (+$64/mo · 95.9%)
ⓘ Screening estimate from a state-policy table — verify with the county assessor before closing.
Climate risk First Street
- Flood 7/10 Severe FEMA zone X (unshaded) · 99% chance over 30 yrs
- Wildfire 5/10 Major
- Heat 9/10 Extreme 7 d/yr ≥106°F today · 20 d/yr by 30 yrs out
- Wind 9/10 Extreme 99% chance of damaging wind over 30 yrs
- Air quality 3/10 Moderate 3 unhealthy d/yr today · 3 by 30 yrs out
Nearby sold comps map
Loading sold comps map…
Walkable amenities ~0.75 mi
Loading nearby amenities…
Taxation est. · year 1
- Rental income
- $25,276
- − Mortgage interest
- −$10,643
- − Property taxes
- −$805
- − Insurance
- −$1,748
- − Repairs & maintenance
- −$2,022
- − Management
- −$2,022
- − Depreciation
- −$5,527
- Taxable income
- $2,510
- Est. tax owed @ 24.0%
- −$602
- After-tax cash flow
- $4,857/yr
For passive investors: Depreciation is non-cash, so a rental often shows a tax loss while cash-flowing — sheltering income. Rental losses are passive: they offset passive income freely, and up to $25,000/yr can offset ordinary (W-2) income if you actively participate and your MAGI is under $100k (phasing out to $0 by $150k); unused losses carry forward. On sale, claimed depreciation is recaptured at up to 25%, and gains may owe capital-gains tax (a 1031 exchange can defer both). Figures are a year-1 estimate at your 24.0% rate — not tax advice; consult a CPA.
Schools (NCES district)
- District
- St. Johns
- NCES district ID
- 1201740
- Math proficiency
- 75% ▼ -5.00%
- Reading proficiency
- 73% ▼ -2.00%
- Median HH income
- $66,842
- Composite
- 64.31/100
- National rank
- #556
- State rank
- #2 of 73 in FL
Livability — St. Augustine South
No livability data for this city. (Only ~50 U.S. cities are tracked.)
Census & demographics
- County
- Saint Johns County · 301,599 people
- Metro
- Jacksonville, FL
- Population (ZIP)
- 34,855
- Household income
- $76,512
- Rent vs Own
- Severe rent burden
- 634.0
Population outlook (St. Johns County) Hauer SSP2
- Today (2025)
- 303,941 people
- By 2030
- 342,590 · +12.7%
- By 2040
- 417,328 · +37.3%
- By 2050
- 487,011 · +60.2%
- By 2075
- 635,395 · +109.1%
- By 2100
- 717,469 · +136.1%
Race, ethnicity, and origin ACS 2023
- Neighborhood character
- Predominantly White (84%)
- Race & ethnicity
- White 84% Hispanic / Latino 8% Two or more races 5% Black 3% Asian 1%
- Hispanic origin (detail)
- Puerto Rican 2% Dominican 1%
- Common ancestry
- Romanian 3% Lithuanian 3% Italian 2%
- Foreign-born
- 7% · Canada, Jamaica, Guatemala
- Languages at home
- 91% English-only · Spanish 5% German/W. Germanic 1% Other Indo-European 1%
Political lean MEDSL · St. Johns
- 2024 margin
- Solid R (+31.4) · D 33.9% · R 65.2%
- 2008→2024 swing
- +0.2pp no change · 2008: -31.6pp · 2024: -31.4pp
- All cycles
- 2024: R+31.4 2020: R+26.7 2016: R+33.4 2012: R+37.8 2008: R+31.6
Not yet ingested
- Civics
- —
Market trends
- HPI YoY
- ▼ -278.21%
- Current HPI
- 306.2813
- Rent YoY
- ▲ 0.85%
- Metro
- Jacksonville, FL
- State GDP YoY
- ▲ 3.28%
- F500 in state
- 36
Industry mix (Fortune 500 HQ in FL)
| Industry | F500 HQs | Revenue |
|---|---|---|
| Industrial Technology | 2 | $29B |
|
||
| Insurance | 2 | $17B |
|
||
| Retail | 1 | $60B |
|
||
| Technology Distribution | 1 | $58B |
|
||
| Homebuilding | 1 | $35B |
|
||
| Technology Manufacturing | 1 | $35B |
|
||
Price history
2 events — show timeline
- 2026-05-19 Pending — St. Augustine and St. Johns County Board of REALTORS®
- 2026-05-15 Listed $190,000 St. Augustine and St. Johns County Board of REALTORS®
Property tax history
+1.9%/yrLatest (2025): $805 · +20.1% YoY. Source: county tax records.
Cash-flow waterfall
monthlySold comps — $/sqft
last 12 mo · ≤1 miLoading sold comps…