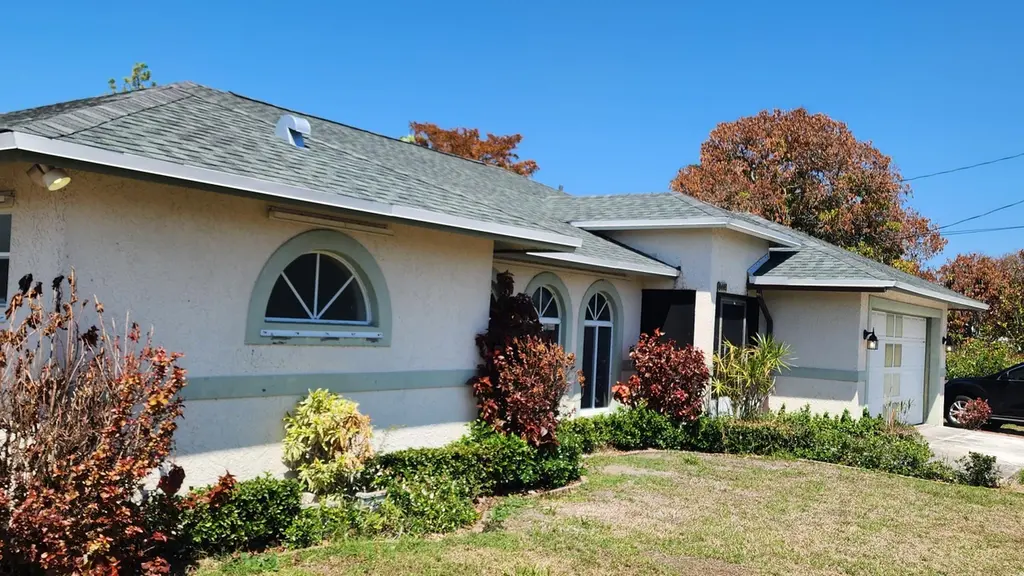
8403 SE Pettway St
Hobe Sound, FL 33455
$395,000C
3 bd · 2.5 ba ·
1,800 sqft ·
Built 1998
· SingleFamily
· Active
· 87 DOM
Cashflow @ list (25.0% down · 7.5%)
Estimated rent
$3,499/mo
Mortgage (P&I)
−$2,071
Tax + insurance
−$302
HOA
−$0
Vac / Maint / Mgmt
−$735
Net cashflow
$391/mo
Annual
$4,691/yr
Cap rate
7.48%
Cash-on-cash
4.24%
DSCR
1.19
1% rule
0.89%
Cash to close
$110,600
Investor read
- This is a 3-bed/2.5-bath single-family listed at $395k.
- At list price, monthly cash flow is $391 ($5k/yr) — positive.
- The deal already cash-flows at list — no discount required.
- To meet the 1% rule (rent ≥ 1% of price), the offer needs to be $350k (11.4% below list).
- It's been on market 87 days — a 6% lower offer ($371k) is reasonable based on typical stale-listing flexibility.
- Recommended offer: $350k (11.4% below list) — sets the bar for 1% rule.
- Local home prices are declining (-3.0%/yr); year-one equity from $3k of loan paydown is wiped out by about $12k of value loss. Plan a longer hold.
- Location reads 69/100 on livability (#497 in FL) — a middle-class / working-renter tenant base. Strengths: housing A+, crime A, cost of living A; Watch: employment C-, amenities F, commute F.
- Martin (suburban): math 52% / reading 53% proficiency, ranked #24 of 73 in FL (top 33%) — acceptable for families but not a draw, mixed tenant base, ~2y average lease.
- Market conditions: Rents rising (+1.8%/yr); 284 active listings in the ZIP; 12 comparable units currently listed for rent nearby; rentals at typical pace (median 25d on market — plan ~3-4 weeks tenant-placement turnaround); 737 units permitted in Martin County in 2024 (167 in 5+ unit buildings).
- Martin County population projected at +19% by 2050 — long-run rental-demand tailwind backs the buy-and-hold thesis.
- Current owner paid $12k; list at $395k implies a 3060% gain — meaningful room to come down on a strong offer.
- Climate carrying-cost: severe wind risk, 99% chance of damaging wind over 30y; extreme-heat days projected 7→25/yr by 2055 (HVAC capex compounding) — expect insurance premiums to compound above CPI over the hold.
- Cap rate 7.5% vs local median 3.4% in Hobe Sound — top-decile yield for the area; either an underpriced asset or a hidden risk that comps aren't pricing in. Stress-test before assuming the spread holds.
- At $3,499/mo this rent would consume 60% of the median local household income ($70k/yr) (locally 317% of renters already pay >50% of income on rent) — very limited rent-growth headroom before tenants either downsize or default.
Questions for listing agent
- It's been on market 87 days. Have you received any prior offers? Is the seller open to a 11% concession, seller financing, or rate buy-down credit?
- Why hasn't it sold? Are there any deal-killer items the seller is aware of (foundation, flood, title, zoning, code violations)?
- Is there a deadline driving the sale (1031 exchange, divorce, estate, relocation)? That informs how much negotiation room exists.
- What's the average days-on-market for RENTAL listings here right now (not sales)? A rising rental-DOM trend means longer vacancies and softer asking-rent achievability than the comps imply.
- What's the recent tenant-quality profile in this submarket — average credit score on applications, eviction rate, late-payment / NSF rate, and stable-employment percentage? A property-management company in the area should have these aggregated.
- How much new for-sale + rental construction is in the pipeline within 1–3 miles? Heavy new supply typically softens prices + rents 12–24 months out; constrained supply supports both.
CashFlowRE · CFR-0FV8PBF0Q40GE5
· Data 4 h ago
cashflowre.app · 2026-05-29