8403 SE Pettway St · Hobe Sound, FL
Flood risk 1/10 · Minimal
- FEMA flood zone
- X (unshaded)
- Chance of flooding over 30 yrs
- 0.0%
- Est. flood insurance / yr
- $507 – $1,088
Fire risk 3/10 · Minor
- Est. fire insurance / yr
- $947 – $1,759
Heat risk 10/10 · Severe
- Hot days now (above 105°F)
- 7 days/yr
- Hot days in 30 yrs
- 25 days/yr
Wind risk 10/10 · Severe
- Chance of severe wind over 30 yrs
- 99.0%
Air-quality risk 2/10 · Minimal
- Unhealthy air days now
- 1 days/yr
- Unhealthy air days in 30 yrs
- 2 days/yr
Risk factors via First Street. Map © Google.
Why this score? — see what drove the C grade
The composite is a weighted blend of 9 inputs, each scored 0–100. Each bar is that input's sub-score; the figure is the points it added to the 100-point composite (weight × sub-score).
- Cash flow +18.7/30.0
- ARV discount +15.0/15.0
- DSCR +5.9/10.0
- Schools +4.5/10.0
- 1% rule +3.9/10.0
- Livability +3.5/5.0
- Rent growth +3.0/5.0
- Condition / age +2.5/5.0
- Appreciation +0.0/10.0
$395,000
🖨 Deal sheet 📄 Offer letter ✓ Due diligence
Listing remarks MLS
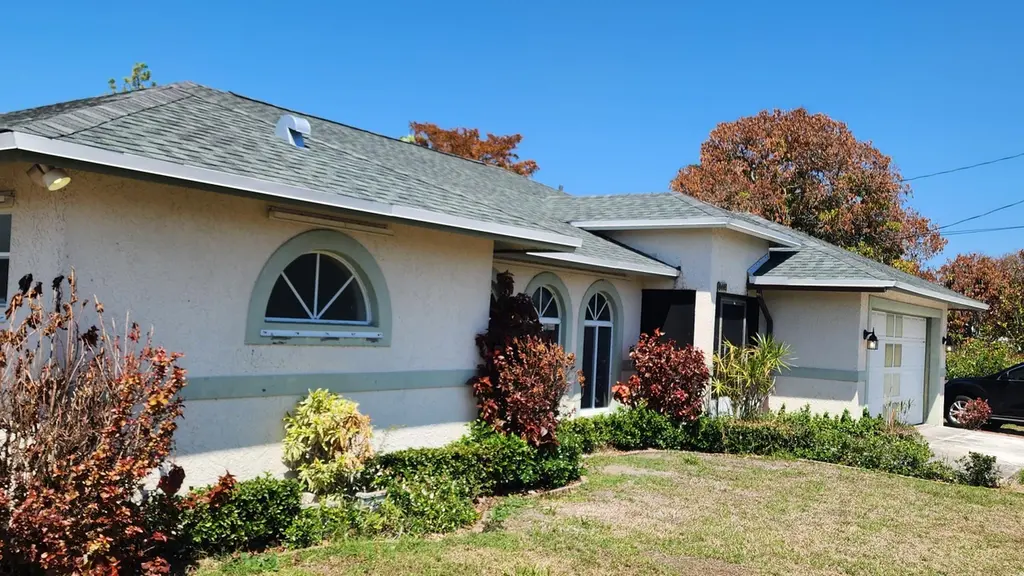
Welcome to 8403 SE Pettway Street in the heart of Hobe Sound—a charming single-family home offering comfort, space, and Florida lifestyle living. This 3-bedroom, 2.5-bath residence features approximately 1,800 square feet of living space with a functional layout perfect for everyday living or entertaining. Built in 1998 and situated on a nearly 7,000 sq ft lot, the property includes an attached garage and solid concrete block construction for durability and peace of mind. Ideally located just minutes from beautiful beaches, parks, and local amenities, this home offers convenience with a laid-back coastal feel. Whether you're a first-time buyer, seasonal resident, or investor, this property is a great opportunity to enjoy the Treasure Coast lifestyle while adding your personal touch.
Key facts
- 6,823 sq ft lot
- Garage
- Built 1998
Neighborhood map
What this means for you Summary
Snapshot
- This is a 3-bed/2.5-bath single-family listed at $395k.
Deal economics
- At list price, monthly cash flow is $391 ($5k/yr) — positive.
- The deal already cash-flows at list — no discount required.
- To meet the 1% rule (rent ≥ 1% of price), the offer needs to be $350k (11.4% below list).
- Recommended offer: $350k (11.4% below list) — sets the bar for 1% rule.
- Cap rate 7.5% vs local median 3.5% in Hobe Sound — top-decile yield for the area; either an underpriced asset or a hidden risk that comps aren't pricing in. Stress-test before assuming the spread holds.
Location & tenants
- Location reads 69/100 on livability (#497 in FL) — a middle-class / working-renter tenant base. Strengths: housing A+, crime A, cost of living A; Watch: employment C-, amenities F, commute F.
- Martin (suburban): math 52% / reading 53% proficiency, ranked #24 of 73 in FL (top 33%) — acceptable for families but not a draw, mixed tenant base, ~2y average lease.
- Market conditions: Rents rising (+1.8%/yr); 279 active listings in the ZIP; 12 comparable units currently listed for rent nearby; rentals at typical pace (median 23d on market — plan ~3-4 weeks tenant-placement turnaround); 737 units permitted in Martin County in 2024 (167 in 5+ unit buildings).
- At $3,499/mo this rent would consume 60% of the median local household income ($70k/yr) (locally 317% of renters already pay >50% of income on rent) — very limited rent-growth headroom before tenants either downsize or default.
Forward outlook
- Local home prices are declining (-3.0%/yr); year-one equity from $3k of loan paydown is wiped out by about $12k of value loss. Plan a longer hold.
- Martin County population projected at +19% by 2050 — long-run rental-demand tailwind backs the buy-and-hold thesis.
Negotiation context
- It's been on market 84 days — a 6% lower offer ($371k) is reasonable based on typical stale-listing flexibility.
- Current owner paid $12k; list at $395k implies a 3060% gain — meaningful room to come down on a strong offer.
Risks & watch-outs
- Climate carrying-cost: severe wind risk, 99% chance of damaging wind over 30y; extreme-heat days projected 7→25/yr by 2055 (HVAC capex compounding) — expect insurance premiums to compound above CPI over the hold.
Questions for the listing agent
- It's been on market 84 days. Have you received any prior offers? Is the seller open to a 11% concession, seller financing, or rate buy-down credit?
- Why hasn't it sold? Are there any deal-killer items the seller is aware of (foundation, flood, title, zoning, code violations)?
- Is there a deadline driving the sale (1031 exchange, divorce, estate, relocation)? That informs how much negotiation room exists.
- What's the average days-on-market for RENTAL listings here right now (not sales)? A rising rental-DOM trend means longer vacancies and softer asking-rent achievability than the comps imply.
- What's the recent tenant-quality profile in this submarket — average credit score on applications, eviction rate, late-payment / NSF rate, and stable-employment percentage? A property-management company in the area should have these aggregated.
- How much new for-sale + rental construction is in the pipeline within 1–3 miles? Heavy new supply typically softens prices + rents 12–24 months out; constrained supply supports both.
Investment metrics
- 1% rule
- 0.89% ✗
- Cap rate
- 7.48%
- Cash-on-cash
- 4.24%
- DSCR
- 1.19
- GRM
- 9.4
CMA / ARV
- ARV (median comp)
- $659,262
- List price
- $395,000
- Delta
- -40.08%
- Verdict
- UNDERPRICED
- Comps
- 20 within 1.0 mi
Show comp detail 12 sales within ~0.75 mi
| Address | Dist | Beds/Ba | Sqft | Sold | Price | $/sf | Match |
|---|---|---|---|---|---|---|---|
| 8565 SE Gulfstream Pl | 0.15mi | 3/2.0 | 1,806 (+0%) | 7mo | $925,000 | $512 | 85 |
| 8361 SE Quail Ridge Way | 0.18mi | 3/2.0 | 1,788 (-1%) | 8mo | $725,000 | $405 | 82 |
| 10636 SE Rosemarie Ct | 0.48mi | 4/2.5 (+1) | 1,867 (+4%) | 5mo | $437,500 | $234 | 62 |
| 8646 SE Alabama Pl | 0.44mi | 4/2.0 (+1) | 1,730 (-4%) | 4mo | $550,000 | $318 | 62 |
| 10340 SE Jupiter Narrows Dr | 0.52mi | 3/2.0 | 1,915 (+6%) | 2mo | $520,000 | $272 | 62 |
| 8884 SE Sandcastle Cir | 0.66mi | 3/2.0 | 1,860 (+3%) | 6mo | $625,000 | $336 | 57 |
| 8996 SE Bahama Cir | 0.69mi | 3/2.5 | 1,717 (-5%) | 4mo | $515,000 | $300 | 57 |
| 10690 SE Jupiter Narrows Dr | 0.70mi | 3/2.0 | 1,942 (+8%) | 3mo | $725,000 | $373 | 50 |
| 10570 SE Jupiter Narrows Dr | 0.65mi | 3/2.0 | 1,882 (+5%) | 13mo | $750,000 | $399 | 50 |
| 8284 SE Woodmere St | 0.41mi | 3/2.0 | 2,038 (+13%) | 16mo | $800,000 | $393 | 44 |
| 8744 SE Jardin St | 0.51mi | 4/2.0 (+1) | 1,624 (-10%) | 12mo | $530,000 | $326 | 42 |
| 9019 SE Hawksbill Way | 0.54mi | 2/2.0 (-1) | 1,641 (-9%) | 15mo | $1,350,000 | $823 | 40 |
Match score weights: distance 35% · size 25% · config 20% · recency 20%. Top-matched comps best support the ARV.
Projected returns pro-forma
-3.0% appreciation · 1.8% rent growth · sell at horizon
- IRR
- -10.9%
- Equity multiple
- 0.61×
- Total profit
- $-43,453
- Equity at exit
- $58,896
- IRR
- -3.3%
- Equity multiple
- 0.79×
- Total profit
- $-23,181
- Equity at exit
- $34,152
Cash invested: $110,600 (down + closing). Projections, not guarantees.
Landlord ↔ Tenant lean methodology
- Overall (STATE)
- 87 Strongly Landlord-Friendly
- State Florida
- 87 Strongly Landlord-Friendly · R+3
- County
- — inherits STATE
- City
- — inherits STATE
ZIP-level market 33455
- Rents YoY
- 1.8%
- Active inventory
- 279
- Price-to-rent
- 9.4×
Monthly cashflow live
- Estimated rent
- $3,499 high interval (Pro) →
- Mortgage (P&I)
- −$2,071
- Tax from tax record
- −$138 /mo · $1,651/yr
- Insurance
- −$165
- HOA
- −$0
- Vacancy / Maint / Mgmt
- −$735
- Net cashflow
- $391
Break-even live
UW: 25.0% down · 7.5% · 30yr · 1.5% tax · 5.0% vac · 8.0% maint · 8.0% mgmt
Financing live
Cash to close
- Down payment
- $98,750
- Closing costs
- $11,850
- Reserves months
- —
- Total cash needed
- —
Loan-product check · same deal, 3 products live
Conventional
25% down · 7.5% · 30yr
- Down + closing
- —
- Monthly P&I
- —
- Monthly cashflow
- —
- DSCR
- —
- Eligible?
- —
Personal DTI + credit; lowest rate.
DSCR
20% down · 8.5% · 30yr
- Down + closing
- —
- Monthly P&I
- —
- Monthly cashflow
- —
- DSCR
- —
- Eligible?
- —
No personal income docs; deal must DSCR.
Hard money
10% down · 12.0% · 12mo
- Down + closing
- —
- Monthly P&I
- —
- Monthly cashflow
- —
- DSCR
- —
- Eligible?
- —
Short-term bridge; refi at stabilization.
Rent comps 12 comps
| Address | Beds | Baths | Sqft | Rent | $/sqft | DOM | Units | Dist |
|---|---|---|---|---|---|---|---|---|
| 8574 SE Seagrape Way Hobe Sound, FL | 3.0 | 2.0 | 1476 | $3,600 | $2.44 | 23d | 1 | 0.22mi |
| 10230 SE Federal Hwy Lot A Hobe Sound, FL | 3.0 | 2.0 | 1600 | $1,850 | $1.16 | 23d | 1 | 0.31mi |
| 7916 SE Sugar Pines Way Hobe Sound, FL | 2.0 | 2.0 | 1350 | $2,700 | $2.00 | 13d | 1 | 0.58mi |
| 9627 Crest Ct Hobe Sound, FL | 2.0 | 2.0 | 1400 | $2,500 | $1.79 | 13d | 1 | 0.58mi |
| 9650 SE Eagle Ave Hobe Sound, FL | 2.0 | 2.0–2.5 | 1241 | $2,330 | $1.88 | 23d | 5 | 0.70mi |
| 11269 SE Blair Ln Hobe Sound, FL | 3.0 | 3.0 | 2523 | $25,000 | $9.91 | 23d | 1 | 0.93mi |
| 8014 SE Carlton St Hobe Sound, FL | 3.0 | 2.0 | 1463 | $3,500 | $2.39 | 23d | 1 | 1.00mi |
| 8968 SE Pine Cone Ln Hobe Sound, FL | 3.0 | 2.0 | 1383 | $2,700 | $1.95 | 23d | 1 | 1.03mi |
| 8455 SE Palm St Hobe Sound, FL | 2.0 | 2.0 | 1423 | $4,700 | $3.30 | 13d | 1 | 1.06mi |
| 8585 SE Palm St Hobe Sound, FL | 2.0 | 2.0 | 1304 | $10,000 | $7.67 | 13d | 1 | 1.12mi |
| 8585 SE Palm St Hobe Sound, FL | 2.0 | 2.0 | 1304 | $10,000 | $7.67 | 23d | 1 | 1.12mi |
| 8075 SE Governors Way Hobe Sound, FL | 4.0 | 2.5 | 2237 | $6,000 | $2.68 | 23d | 1 | 1.16mi |
Listing history 19 events
-
2026-06-18days on market $395,000 Active 84 DOM
-
2026-06-17days on market $395,000 Active 83 DOM
-
2026-06-16days on market $395,000 Active 82 DOM
-
2026-06-15days on market $395,000 Active 81 DOM
-
2026-06-14days on market $395,000 Active 79 DOM
-
2026-06-13days on market $395,000 Active 78 DOM
-
2026-06-10days on market $395,000 Active 76 DOM
-
2026-06-09days on market $395,000 Active 75 DOM
-
2026-06-08days on market $395,000 Active 74 DOM
-
2026-06-07days on market $395,000 Active 73 DOM
-
2026-06-03days on market $395,000 Active 69 DOM
-
2026-06-02days on market $395,000 Active 68 DOM
-
2026-06-01days on market $395,000 Active 67 DOM
-
2026-05-31days on market $395,000 Active 66 DOM
-
2026-05-31pricedays on market $395,000 Active 65 DOM
-
2026-04-20price $400,000 800-char remark
Show marketing remark (800 chars)
Welcome to 8403 SE Pettway Street in the heart of Hobe Sound—a charming single-family home offering comfort, space, and Florida lifestyle living. This 3-bedroom, 2.5-bath residence features approximately 1,800 square feet of living space with a functional layout perfect for everyday living or entertaining. Built in 1998 and situated on a nearly 7,000 sq ft lot, the property includes an attached garage and solid concrete block construction for durability and peace of mind. Ideally located just minutes from beautiful beaches, parks, and local amenities, this home offers convenience with a laid-back coastal feel. Whether you're a first-time buyer, seasonal resident, or investor, this property is a great opportunity to enjoy the Treasure Coast lifestyle while adding your personal touch.
-
2026-04-02price $425,000 800-char remark
Show marketing remark (800 chars)
Welcome to 8403 SE Pettway Street in the heart of Hobe Sound—a charming single-family home offering comfort, space, and Florida lifestyle living. This 3-bedroom, 2.5-bath residence features approximately 1,800 square feet of living space with a functional layout perfect for everyday living or entertaining. Built in 1998 and situated on a nearly 7,000 sq ft lot, the property includes an attached garage and solid concrete block construction for durability and peace of mind. Ideally located just minutes from beautiful beaches, parks, and local amenities, this home offers convenience with a laid-back coastal feel. Whether you're a first-time buyer, seasonal resident, or investor, this property is a great opportunity to enjoy the Treasure Coast lifestyle while adding your personal touch.
-
2026-03-26$450,000 Active 800-char remark
Show marketing remark (800 chars)
Welcome to 8403 SE Pettway Street in the heart of Hobe Sound—a charming single-family home offering comfort, space, and Florida lifestyle living. This 3-bedroom, 2.5-bath residence features approximately 1,800 square feet of living space with a functional layout perfect for everyday living or entertaining. Built in 1998 and situated on a nearly 7,000 sq ft lot, the property includes an attached garage and solid concrete block construction for durability and peace of mind. Ideally located just minutes from beautiful beaches, parks, and local amenities, this home offers convenience with a laid-back coastal feel. Whether you're a first-time buyer, seasonal resident, or investor, this property is a great opportunity to enjoy the Treasure Coast lifestyle while adding your personal touch.
-
1995-02-24soldstatus $12,500
ⓘ Source: listings_history table (triggers on properties + properties_extension) + one-shot
backfill from property_details.listing_events for pre-trigger history.
Tax reassessment forecast FL · Resets to sale price
- Current annual tax
- $1,651 · $138/mo
- Projected year-2 tax
- $3,278 · $273/mo
- Expected delta
- +$1,627/yr (+$136/mo · 98.5%)
ⓘ Screening estimate from a state-policy table — verify with the county assessor before closing.
Climate risk First Street
- Flood 1/10 Low FEMA zone X (unshaded) · 0% chance over 30 yrs
- Wildfire 3/10 Moderate
- Heat 10/10 Extreme 7 d/yr ≥105°F today · 25 d/yr by 30 yrs out
- Wind 10/10 Extreme 99% chance of damaging wind over 30 yrs
- Air quality 2/10 Low 1 unhealthy d/yr today · 2 by 30 yrs out
Nearby sold comps map
Loading sold comps map…
Walkable amenities ~0.75 mi
Loading nearby amenities…
Taxation est. · year 1
- Rental income
- $41,992
- − Mortgage interest
- −$22,126
- − Property taxes
- −$1,651
- − Insurance
- −$1,975
- − Repairs & maintenance
- −$3,359
- − Management
- −$3,359
- − Depreciation
- −$11,491
- Taxable loss
- −$1,970
- Est. tax savings @ 24.0%
- +$473
- After-tax cash flow
- $5,163/yr
For passive investors: Depreciation is non-cash, so a rental often shows a tax loss while cash-flowing — sheltering income. Rental losses are passive: they offset passive income freely, and up to $25,000/yr can offset ordinary (W-2) income if you actively participate and your MAGI is under $100k (phasing out to $0 by $150k); unused losses carry forward. On sale, claimed depreciation is recaptured at up to 25%, and gains may owe capital-gains tax (a 1031 exchange can defer both). Figures are a year-1 estimate at your 24.0% rate — not tax advice; consult a CPA.
Schools (NCES district)
- District
- Martin
- NCES district ID
- 1201290
- Math proficiency
- 52% ▼ -14.00%
- Reading proficiency
- 53% ▼ -4.00%
- Median HH income
- $52,482
- Composite
- 45.1/100
- National rank
- #2690
- State rank
- #24 of 73 in FL
Livability — Hobe Sound
- Score
- 69/100
- State rank
- #497
- US rank
- #8763
Category grades
Schools grade is shown separately in the Schools card above.
Census & demographics
- Census place
- Hobe Sound, FL
- County
- Martin County · 165,223 people
- City population
- 20,018
- Metro
- Port St. Lucie, FL
- Population (ZIP)
- 20,018
- Household income
- $70,389
- Rent vs Own
- Severe rent burden
- 317.0
Population outlook (Martin County) Hauer SSP2
- Today (2025)
- 172,383 people
- By 2030
- 180,192 · +4.5%
- By 2040
- 194,114 · +12.6%
- By 2050
- 204,992 · +18.9%
- By 2075
- 229,641 · +33.2%
- By 2100
- 232,146 · +34.7%
Race, ethnicity, and origin ACS 2023
- Neighborhood character
- Predominantly White (84%)
- Race & ethnicity
- White 84% Hispanic / Latino 8% Two or more races 6% Black 5% Asian 1%
- Hispanic origin (detail)
- Mexican 3% Dominican 1%
- Common ancestry
- Romanian 5% Italian 2% Slovak 2%
- Foreign-born
- 8% · Canada
- Languages at home
- 91% English-only · Spanish 6% Other Indo-European 1%
Political lean MEDSL · Martin
- 2024 margin
- Solid R (+31.1) · D 34.1% · R 65.2%
- 2008→2024 swing
- -17.5pp toward R · 2008: -13.6pp · 2024: -31.1pp
- All cycles
- 2024: R+31.1 2020: R+24.6 2016: R+26.9 2012: R+22.9 2008: R+13.6
Not yet ingested
- Civics
- —
Market trends
- HPI YoY
- ▼ -287.05%
- Current HPI
- 356.7273
- Rent YoY
- ▲ 1.80%
- Metro
- Port St. Lucie, FL
- State GDP YoY
- ▲ 3.28%
- F500 in state
- 36
Industry mix (Fortune 500 HQ in FL)
| Industry | F500 HQs | Revenue |
|---|---|---|
| Industrial Technology | 2 | $29B |
|
||
| Insurance | 2 | $17B |
|
||
| Retail | 1 | $60B |
|
||
| Technology Distribution | 1 | $58B |
|
||
| Homebuilding | 1 | $35B |
|
||
| Technology Manufacturing | 1 | $35B |
|
||
Price history
+3100.0% since first listed4 events — show timeline
- 2026-04-20 Price Changed $400,000 Beaches MLS
- 2026-04-02 Price Changed $425,000 Beaches MLS
- 2026-03-26 Listed $450,000 Beaches MLS
- 1995-02-24 Sold (Public Records) $12,500 Public Records
Property tax history
-0.3%/yrLatest (2025): $1,651 · +0.5% YoY. Source: county tax records.
Cash-flow waterfall
monthlySold comps — $/sqft
last 12 mo · ≤1 miLoading sold comps…