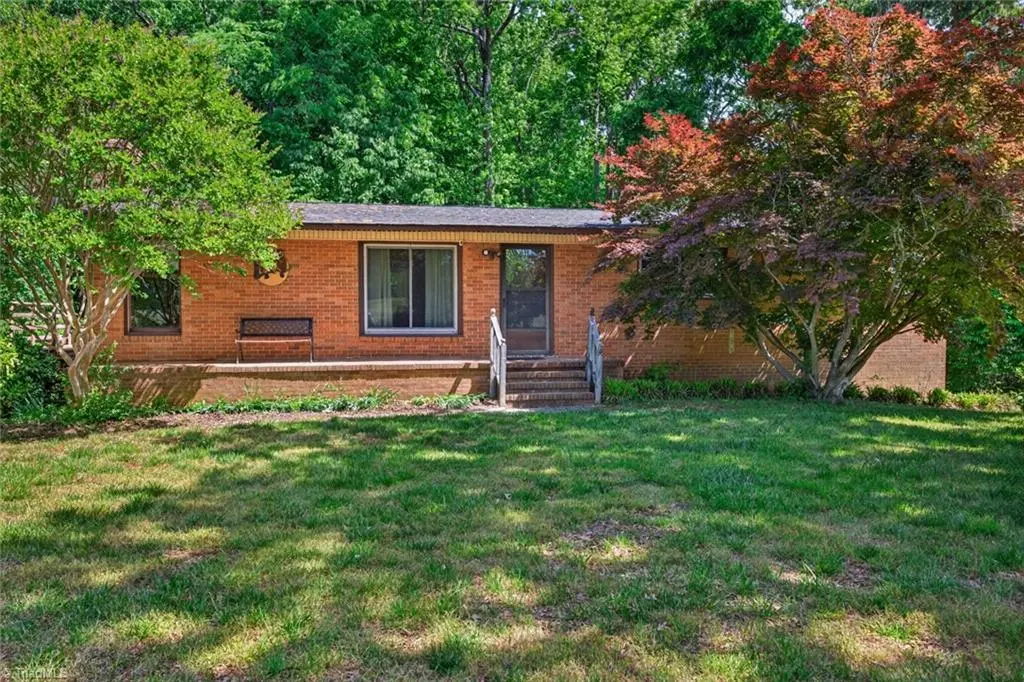
9791 Old Liberty Rd
Liberty, NC 27298
$199,900D+
3 bd · 1.0 ba ·
1,400 sqft ·
Built 1960
· SingleFamily
· Pending
· 23 DOM
Cashflow @ list (25.0% down · 7.5%)
Estimated rent
$1,814/mo
Mortgage (P&I)
−$1,048
Tax + insurance
−$157
HOA
−$0
Vac / Maint / Mgmt
−$381
Net cashflow
$228/mo
Annual
$2,736/yr
Cap rate
7.66%
Cash-on-cash
4.89%
DSCR
1.22
1% rule
0.91%
Cash to close
$55,972
Investor read
- This is a 3-bed/1.0-bath single-family listed at $200k.
- At list price, monthly cash flow is $228 ($3k/yr) — positive.
- The deal already cash-flows at list — no discount required.
- To meet the 1% rule (rent ≥ 1% of price), the offer needs to be $181k (9.2% below list).
- It's been on market 23 days — a 2% lower offer ($197k) is reasonable based on typical stale-listing flexibility.
- Recommended offer: $181k (9.2% below list) — sets the bar for 1% rule.
- Local home prices are declining (-3.0%/yr); year-one equity from $1k of loan paydown is wiped out by about $6k of value loss. Plan a longer hold.
- Location reads 74/100 on livability (#56 in NC, #4,472 nationally) — a middle-class / working-renter tenant base. Strengths: cost of living A+, housing A+, health & safety A+; Watch: amenities F, commute F, employment F.
- Randolph County School System (rural): math 43% / reading 43% proficiency, ranked #94 of 178 in NC (top 53%) — families likely to look elsewhere, expect single-tenant / working-renter base with shorter leases.
- Zoned schools: Liberty Elementary School (math 42% / reading 37%, grade F, #694 of 1,410 statewide, top 53%, 415 students, 77% FRL); Northeastern Randolph Middle School (math 36% / reading 39%, grade F, #256 of 475 statewide, top 55%, 481 students, 61% FRL); Providence Grove High School (math 47% / reading 52%, grade D, #311 of 535 statewide, top 60%, 653 students, 51% FRL).
- Market conditions: 80 active listings in the ZIP; 789 units permitted in Randolph County in 2024 (168 in 5+ unit buildings).
- Randolph County population projected to shrink 10% by 2050 — rents likely to lag national; underwrite the cash flow, not the appreciation.
- Climate carrying-cost: moderate wind risk, 22% chance of damaging wind over 30y; extreme-heat days projected 7→17/yr by 2055 (HVAC capex compounding) — expect insurance premiums to compound above CPI over the hold.
- Cap rate 7.7% vs local median 4.1% in Liberty — top-decile yield for the area; either an underpriced asset or a hidden risk that comps aren't pricing in. Stress-test before assuming the spread holds.
Questions for listing agent
- Built in 1960 — when were the roof, HVAC, electrical panel, plumbing, and water heater last replaced?
- Is there a deadline driving the sale (1031 exchange, divorce, estate, relocation)? That informs how much negotiation room exists.
- Schools are F-rated, which usually means shorter tenancies and higher turnover. Who's the typical renter profile here, and what's been the actual vacancy rate?
- The area grade is low — what's the realistic commute time and amenity access for the typical tenant pool here? Any planned neighborhood developments (good or bad) we should know about?
- What's the average days-on-market for RENTAL listings here right now (not sales)? A rising rental-DOM trend means longer vacancies and softer asking-rent achievability than the comps imply.
- What's the recent tenant-quality profile in this submarket — average credit score on applications, eviction rate, late-payment / NSF rate, and stable-employment percentage? A property-management company in the area should have these aggregated.
- How much new for-sale + rental construction is in the pipeline within 1–3 miles? Heavy new supply typically softens prices + rents 12–24 months out; constrained supply supports both.
CashFlowRE · CFR-0G6YQVA9PKVYMD
· Data 3 weeks ago
cashflowre.app · 2026-05-29