9791 Old Liberty Rd · Liberty, NC
Flood risk 1/10 · Minimal
- FEMA flood zone
- X (unshaded)
- Chance of flooding over 30 yrs
- 0.0%
- Est. flood insurance / yr
- $473 – $860
Fire risk 4/10 · Minor
- Est. fire insurance / yr
- $906 – $1,684
Heat risk 5/10 · Moderate
- Hot days now (above 103°F)
- 7 days/yr
- Hot days in 30 yrs
- 17 days/yr
Wind risk 5/10 · Moderate
- Chance of severe wind over 30 yrs
- 22.0%
Air-quality risk 2/10 · Minimal
- Unhealthy air days now
- 1 days/yr
- Unhealthy air days in 30 yrs
- 1 days/yr
Risk factors via First Street. Map © Google.
Why this score? — see what drove the D+ grade
The composite is a weighted blend of 9 inputs, each scored 0–100. Each bar is that input's sub-score; the figure is the points it added to the 100-point composite (weight × sub-score).
- Cash flow +19.5/30.0
- ARV discount +7.5/15.0
- DSCR +6.2/10.0
- 1% rule +4.1/10.0
- Livability +3.7/5.0
- Schools +3.6/10.0
- Rent growth +2.5/5.0
- Condition / age +2.5/5.0
- Appreciation +0.0/10.0
$199,900
🖨 Deal sheet (PDF) 📄 Offer letter ✓ Due diligence
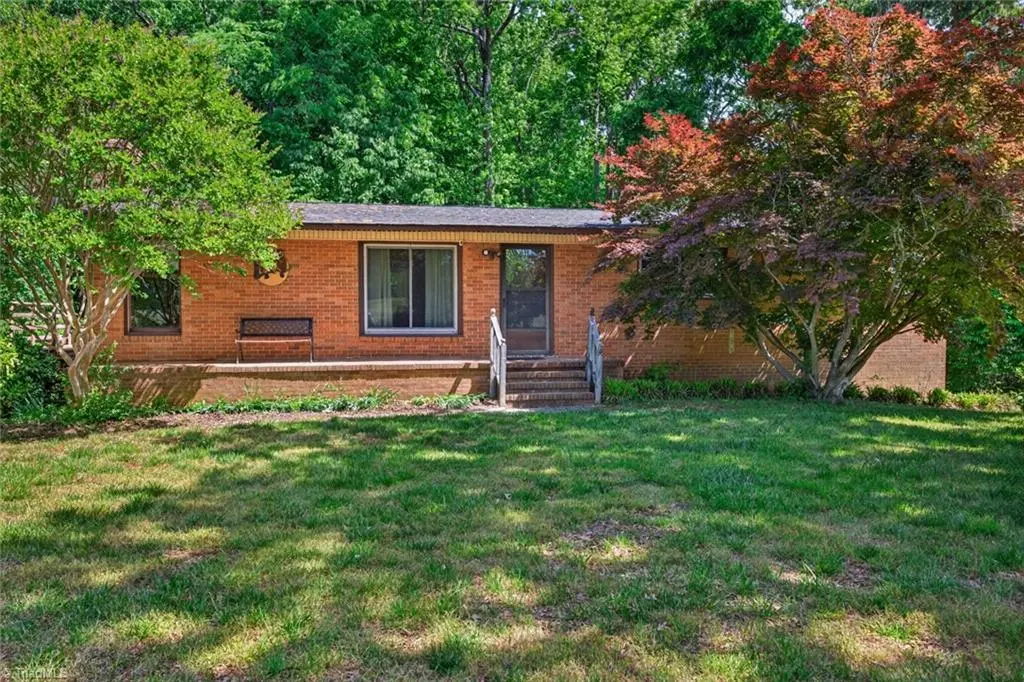
Listing remarks
Cute brick ranch nestled in Liberty with endless potential! This 3 bedroom 1 bath home offers a full unfinished basement, providing plenty of space for storage, a workshop, or future expansion. An additional bathroom is located downstairs and just needs finishing touches to become a 2nd bathroom. Situated in a beautiful setting, this home is FULL of opportunity and ready for your personal touch!
Key facts
- Brick ranch
- 0.75 acre lot
- Built 1960
Tags
Property features AI
Finance
- HOA & community: No homeowners association
Exterior
- Parking: Driveway
- Utilities: Private water source; Septic tank
- Home design: Residential stick/site-built house; One story; Built in 1960; Existing structure; Two fireplaces (basement and den)
- Construction: Brick construction
- Exterior features: Garden; Partially cleared lot; Private maintained road
Interior
- Kitchen: Range
- Bedrooms: Primary bedroom on main level
- Flooring: Carpet; Vinyl
- Bathrooms: 2 full bathrooms
- Heating & cooling: Heat pump heating; Electric heating; Central air conditioning; Electric water heater
- Interior features: Ceiling fans; Attic access only; Has primary bedroom on the main level
- Laundry & utility: Washer hookup; Dryer connection; Laundry in basement
Neighborhood map
What this means for you Summary
Snapshot
- This is a 3-bed/1.0-bath single-family listed at $200k.
Deal economics
- At list price, monthly cash flow is $228 ($3k/yr) — positive.
- The deal already cash-flows at list — no discount required.
- To meet the 1% rule (rent ≥ 1% of price), the offer needs to be $181k (9.2% below list).
- Recommended offer: $181k (9.2% below list) — sets the bar for 1% rule.
- Cap rate 7.7% vs local median 4.1% in Liberty — top-decile yield for the area; either an underpriced asset or a hidden risk that comps aren't pricing in. Stress-test before assuming the spread holds.
Location & tenants
- Location reads 74/100 on livability (#56 in NC, #4,472 nationally) — a middle-class / working-renter tenant base. Strengths: cost of living A+, housing A+, health & safety A+; Watch: amenities F, commute F, employment F.
- Randolph County School System (rural): math 43% / reading 43% proficiency, ranked #94 of 178 in NC (top 53%) — families likely to look elsewhere, expect single-tenant / working-renter base with shorter leases.
- Zoned schools: Liberty Elementary School (math 42% / reading 37%, grade F, #694 of 1,410 statewide, top 53%, 415 students, 77% FRL); Northeastern Randolph Middle School (math 36% / reading 39%, grade F, #256 of 475 statewide, top 55%, 481 students, 61% FRL); Providence Grove High School (math 47% / reading 52%, grade D, #311 of 535 statewide, top 60%, 653 students, 51% FRL).
- Market conditions: 80 active listings in the ZIP; 789 units permitted in Randolph County in 2024 (168 in 5+ unit buildings).
Forward outlook
- Local home prices are declining (-3.0%/yr); year-one equity from $1k of loan paydown is wiped out by about $6k of value loss. Plan a longer hold.
- Randolph County population projected to shrink 10% by 2050 — rents likely to lag national; underwrite the cash flow, not the appreciation.
Negotiation context
- It's been on market 23 days — a 2% lower offer ($197k) is reasonable based on typical stale-listing flexibility.
Risks & watch-outs
- Climate carrying-cost: moderate wind risk, 22% chance of damaging wind over 30y; extreme-heat days projected 7→17/yr by 2055 (HVAC capex compounding) — expect insurance premiums to compound above CPI over the hold.
Questions for the listing agent
- Built in 1960 — when were the roof, HVAC, electrical panel, plumbing, and water heater last replaced?
- Is there a deadline driving the sale (1031 exchange, divorce, estate, relocation)? That informs how much negotiation room exists.
- Schools are F-rated, which usually means shorter tenancies and higher turnover. Who's the typical renter profile here, and what's been the actual vacancy rate?
- The area grade is low — what's the realistic commute time and amenity access for the typical tenant pool here? Any planned neighborhood developments (good or bad) we should know about?
- What's the average days-on-market for RENTAL listings here right now (not sales)? A rising rental-DOM trend means longer vacancies and softer asking-rent achievability than the comps imply.
- What's the recent tenant-quality profile in this submarket — average credit score on applications, eviction rate, late-payment / NSF rate, and stable-employment percentage? A property-management company in the area should have these aggregated.
- How much new for-sale + rental construction is in the pipeline within 1–3 miles? Heavy new supply typically softens prices + rents 12–24 months out; constrained supply supports both.
Investment metrics
- 1% rule
- 0.91% ✗
- Cap rate
- 7.66%
- Cash-on-cash
- 4.89%
- DSCR
- 1.22
- GRM
- 9.2
CMA / ARV
No comps found within radius.
Projected returns pro-forma
-3.0% appreciation · 3.0% rent growth · sell at horizon
- IRR
- -8.7%
- Equity multiple
- 0.68×
- Total profit
- $-17,951
- Equity at exit
- $29,806
- IRR
- 0.7%
- Equity multiple
- 1.05×
- Total profit
- $2,739
- Equity at exit
- $17,284
Cash invested: $55,972 (down + closing). Projections, not guarantees.
Landlord ↔ Tenant lean methodology
- Overall (STATE)
- 85 Strongly Landlord-Friendly
- State North Carolina
- 85 Strongly Landlord-Friendly · R+3
- County
- — inherits STATE
- City
- — inherits STATE
ZIP-level market 27298
- Home prices YoY
- -12.8%
- Active inventory
- 80
- Price-to-rent
- 9.2×
Monthly cashflow live
- Estimated rent
- $1,814 medium interval (Pro) →
- Mortgage (P&I)
- −$1,048
- Tax from tax record
- −$74 /mo · $884/yr
- Insurance
- −$83
- HOA
- −$0
- Vacancy / Maint / Mgmt
- −$381
- Net cashflow
- $228
Break-even live
Sensitivity live
| Price | -10% $341 | -5% $285 | +0% $228 | +5% $171 | +10% $115 |
|---|---|---|---|---|---|
| Rent | -10% $85 | -5% $156 | +0% $228 | +5% $300 | +10% $371 |
| Rate | -1.0pp $329 | -0.5pp $279 | base $228 | +0.5pp $176 | +1.0pp $124 |
UW: 25.0% down · 7.5% · 30yr · 1.5% tax · 5.0% vac · 8.0% maint · 8.0% mgmt
Financing live
Cash to close
- Down payment
- $49,975
- Closing costs
- $5,997
- Reserves months
- —
- Total cash needed
- —
Loan-product check · same deal, 3 products live
Conventional
25% down · 7.5% · 30yr
- Down + closing
- —
- Monthly P&I
- —
- Monthly cashflow
- —
- DSCR
- —
- Eligible?
- —
Personal DTI + credit; lowest rate.
DSCR
20% down · 8.5% · 30yr
- Down + closing
- —
- Monthly P&I
- —
- Monthly cashflow
- —
- DSCR
- —
- Eligible?
- —
No personal income docs; deal must DSCR.
Hard money
10% down · 12.0% · 12mo
- Down + closing
- —
- Monthly P&I
- —
- Monthly cashflow
- —
- DSCR
- —
- Eligible?
- —
Short-term bridge; refi at stabilization.
Listing history 3 events
-
2026-05-31status $199,900 Pending 23 DOM
-
2026-05-09historical Due Diligence Period
-
2026-05-05$199,900 Active
ⓘ Source: listings_history table (triggers on properties + properties_extension) + one-shot
backfill from property_details.listing_events for pre-trigger history.
Tax reassessment forecast NC · Resets to sale price
- Current annual tax
- $884 · $74/mo
- Projected year-2 tax
- $1,639 · $137/mo
- Expected delta
- +$755/yr (+$63/mo · 85.4%)
ⓘ Screening estimate from a state-policy table — verify with the county assessor before closing.
Climate risk First Street
- Flood 1/10 Low FEMA zone X (unshaded) · 0% chance over 30 yrs
- Wildfire 4/10 Moderate
- Heat 5/10 Major 7 d/yr ≥103°F today · 17 d/yr by 30 yrs out
- Wind 5/10 Major 22% chance of damaging wind over 30 yrs
- Air quality 2/10 Low 1 unhealthy d/yr today · 1 by 30 yrs out
Nearby sold comps map
Loading sold comps map…
Walkable amenities ~0.75 mi
Loading nearby amenities…
Taxation est. · year 1
- Rental income
- $21,771
- − Mortgage interest
- −$11,198
- − Property taxes
- −$884
- − Insurance
- −$1,000
- − Repairs & maintenance
- −$1,742
- − Management
- −$1,742
- − Depreciation
- −$5,815
- Taxable loss
- −$609
- Est. tax savings @ 24.0%
- +$146
- After-tax cash flow
- $2,882/yr
For passive investors: Depreciation is non-cash, so a rental often shows a tax loss while cash-flowing — sheltering income. Rental losses are passive: they offset passive income freely, and up to $25,000/yr can offset ordinary (W-2) income if you actively participate and your MAGI is under $100k (phasing out to $0 by $150k); unused losses carry forward. On sale, claimed depreciation is recaptured at up to 25%, and gains may owe capital-gains tax (a 1031 exchange can defer both). Figures are a year-1 estimate at your 24.0% rate — not tax advice; consult a CPA.
Schools (NCES district)
- District
- Randolph County School System
- NCES district ID
- 3703780
- Math proficiency
- 43% ▲ 1.00%
- Reading proficiency
- 43% ▲ 2.00%
- Median HH income
- $43,490
- Composite
- 36.37/100
- National rank
- #4686
- State rank
- #94 of 178 in NC
Livability — Liberty
- Score
- 74/100
- State rank
- #56
- US rank
- #4472
Category grades
Schools grade is shown separately in the Schools card above.
Census & demographics
- Population (ZIP)
- 10,507
Population outlook (Randolph County) Hauer SSP2
- Today (2025)
- 142,640 people
- By 2030
- 140,911 · -1.2%
- By 2040
- 135,692 · -4.9%
- By 2050
- 128,575 · -9.9%
- By 2075
- 111,507 · -21.8%
- By 2100
- 93,376 · -34.5%
Race, ethnicity, and origin ACS 2023
- Neighborhood character
- Predominantly White (76%)
- Race & ethnicity
- White 76% Hispanic / Latino 15% Two or more races 10% Black 7%
- Hispanic origin (detail)
- Mexican 12%
- Common ancestry
- Slovak 4% Lithuanian 2% Serbian 1%
- Foreign-born
- 7% · Canada
- Languages at home
- 90% English-only · Spanish 9% French/Haitian/Cajun 1%
Political lean MEDSL · Randolph
- 2024 margin
- Solid R (+57.2) · D 21.0% · R 78.3%
- 2008→2024 swing
- -15.0pp toward R · 2008: -42.3pp · 2024: -57.2pp
- All cycles
- 2024: R+57.2 2020: R+56.3 2016: R+56.7 2012: R+50.2 2008: R+42.3
Not yet ingested
- Civics
- —
Market trends
- HPI YoY
- ▼ -37.90%
- Current HPI
- 257.7834
- Rent YoY
- —
- Metro
- —
- State GDP YoY
- ▲ 3.28%
- F500 in state
- 26
Industry mix (Fortune 500 HQ in NC)
| Industry | F500 HQs | Revenue |
|---|---|---|
| Financial Services | 2 | $213B |
|
||
| Retail | 2 | $95B |
|
||
| Industrial Conglomerate | 1 | $38B |
|
||
| Metals / Steel | 1 | $35B |
|
||
| Utilities | 1 | $30B |
|
||
| Industrial Machinery | 1 | $19B |
|
||
Price history
2 events — show timeline
- 2026-05-09 Contingent — Triad MLS
- 2026-05-05 Listed $199,900 Triad MLS
Property tax history
+3.7%/yrLatest (2025): $884 · +0.0% YoY. Source: county tax records.
Cash-flow waterfall
monthlySold comps — $/sqft
last 12 mo · ≤1 miLoading sold comps…