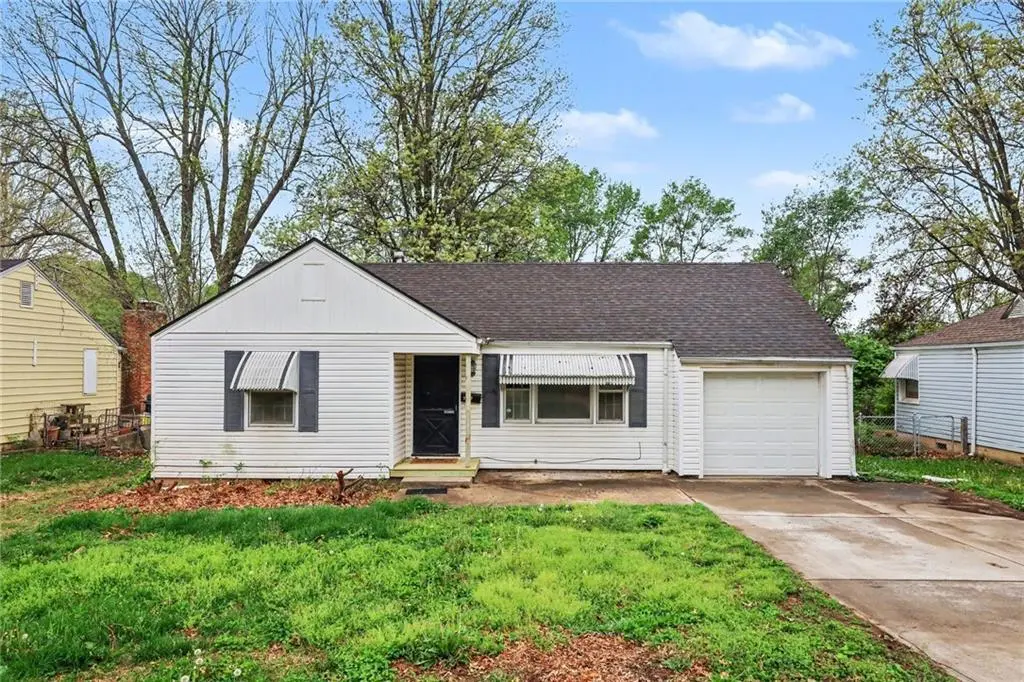
7723 Sni-a-bar Rd
Kansas City, MO 64129
$125,000B-
3 bd · 1.0 ba ·
1,262 sqft ·
Built 1950
· SingleFamily
· Pending
· 4 DOM
Cashflow @ list (25.0% down · 7.5%)
Estimated rent
$1,440/mo
Mortgage (P&I)
−$656
Tax + insurance
−$145
HOA
−$0
Vac / Maint / Mgmt
−$302
Net cashflow
$337/mo
Annual
$4,042/yr
Cap rate
9.53%
Cash-on-cash
11.55%
DSCR
1.51
1% rule
1.15%
Cash to close
$35,000
Investor read
- This is a 3-bed/1.0-bath single-family listed at $125k.
- At list price, monthly cash flow is $337 ($4k/yr) — positive.
- The deal already cash-flows at list — no discount required.
- Meets the 1% rule at list price ($1k rent vs $125k).
- Only 4 days on market — expect competitive offers; lowballing is unlikely to land.
- Local home prices are declining (-3.0%/yr); year-one equity from $864 of loan paydown is wiped out by about $4k of value loss. Plan a longer hold.
- Location reads 78/100 on livability (#28 in MO, #2,671 nationally) — a middle-class / working-renter tenant base. Strengths: amenities A+, commute A+, cost of living A+; Watch: crime F.
- Raytown C-2 (suburban): math 12% / reading 28% proficiency, ranked #302 of 324 in MO (top 93%) — low school quality limits family demand, transient renter base, plan for 1-2y turnover.
- Zoned schools: Eastwood Hills Elem. (math 8% / reading 22%, grade F, #982 of 1,115 statewide, top 89%, 329 students, 82% FRL); Raytown Sr. High (math 7% / reading 29%, grade F, #482 of 521 statewide, top 92%, 1,365 students, 65% FRL) — zoned schools average 74% FRL vs 54% district-wide (20 pts higher); higher-poverty schools than district average — tighter screening recommended.
- Watch-outs: built in 1950 — expect roof / HVAC / electrical / plumbing capex.
- Market conditions: 52 active listings in the ZIP; 11 comparable units currently listed for rent nearby; rentals at typical pace (median 22d on market — plan ~3-4 weeks tenant-placement turnaround); 4,002 units permitted in Jackson County in 2024 (2,271 in 5+ unit buildings).
- Jackson County population projected at +4% by 2050 — modest demand growth; plan on rents tracking national, not racing it.
- 4 sale attempts since 11y ago with the ask held roughly flat each time — persistent listings suggest the price (not the market) is what's stuck; bring a comps-based counter.
- At projected returns (-3.0% appreciation + 3.0% rent growth), your $35k cash investment doubles in ~10 years — after that, you're playing with house money.
- Cap rate 9.5% vs local median 3.9% in Kansas City — top-decile yield for the area; either an underpriced asset or a hidden risk that comps aren't pricing in. Stress-test before assuming the spread holds.
- This rent runs 34% of the median local income ($51k/yr) — at the standard rent-burdened threshold; future hikes will face affordability resistance.
Questions for listing agent
- Built in 1950 — when were the roof, HVAC, electrical panel, plumbing, and water heater last replaced?
- Is there a deadline driving the sale (1031 exchange, divorce, estate, relocation)? That informs how much negotiation room exists.
- Crime grade is F in this area — have there been break-ins, vandalism, or insurance claims at this property in the last 3 years? What carrier currently insures it and at what premium?
- What's the average days-on-market for RENTAL listings here right now (not sales)? A rising rental-DOM trend means longer vacancies and softer asking-rent achievability than the comps imply.
- What's the recent tenant-quality profile in this submarket — average credit score on applications, eviction rate, late-payment / NSF rate, and stable-employment percentage? A property-management company in the area should have these aggregated.
- How much new for-sale + rental construction is in the pipeline within 1–3 miles? Heavy new supply typically softens prices + rents 12–24 months out; constrained supply supports both.
CashFlowRE · CFR-0GFWYKCN92C3KP
· Data 3 weeks ago
cashflowre.app · 2026-05-29