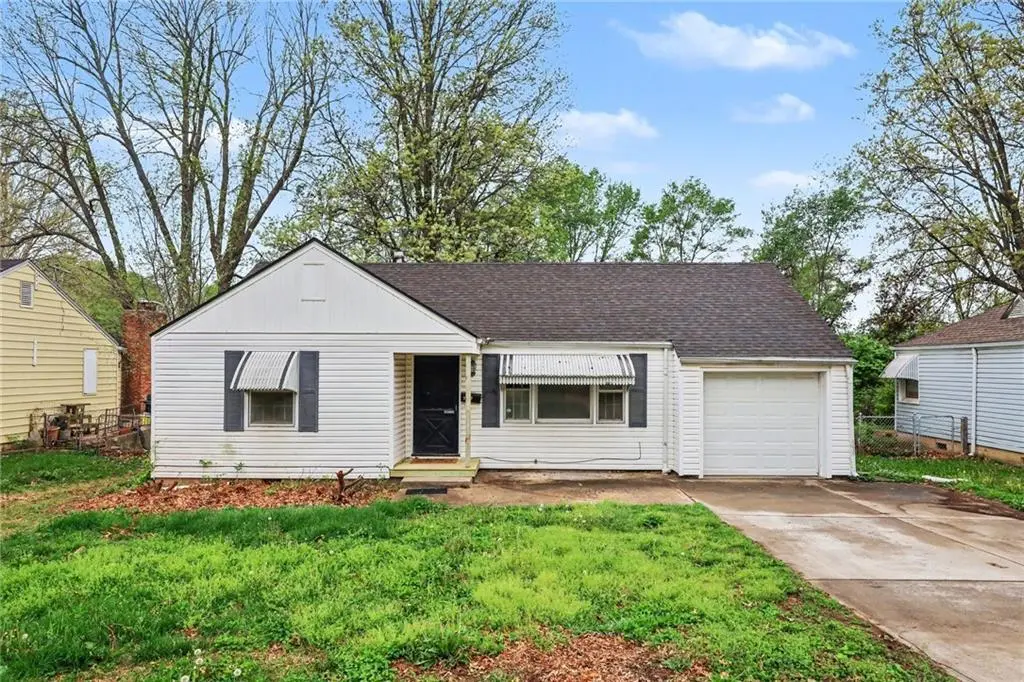
7723 Sni-a-bar Rd · Kansas City, MO
Flood risk 1/10 · Minimal
- FEMA flood zone
- X (unshaded)
- Chance of flooding over 30 yrs
- 0.0%
- Est. flood insurance / yr
- $507 – $1,088
Fire risk 1/10 · Minimal
- Est. fire insurance / yr
- $1,054 – $1,958
Heat risk 4/10 · Minor
- Hot days now (above 107°F)
- 7 days/yr
- Hot days in 30 yrs
- 16 days/yr
Wind risk 2/10 · Minimal
- Chance of severe wind over 30 yrs
- —
Air-quality risk 3/10 · Minor
- Unhealthy air days now
- 3 days/yr
- Unhealthy air days in 30 yrs
- 5 days/yr
Risk factors via First Street. Map © Google.
Why this score? — see what drove the B- grade
The composite is a weighted blend of 9 inputs, each scored 0–100. Each bar is that input's sub-score; the figure is the points it added to the 100-point composite (weight × sub-score).
- Cash flow +26.7/30.0
- ARV discount +15.0/15.0
- DSCR +9.1/10.0
- 1% rule +6.5/10.0
- Livability +3.9/5.0
- Rent growth +2.5/5.0
- Condition / age +2.5/5.0
- Schools +1.8/10.0
- Appreciation +0.0/10.0
$125,000
🖨 Deal sheet 📄 Offer letter ✓ Due diligence
Listing remarks MLS
Super Cute Ranch!!! Would be great for an investor or first time homeowner! Kansas city address with Raytown Schools. Vinyl siding for low maintenance. Nice lot with fenced back yard. Large living room with additional family room added on the back with fireplace. Laundry off the kitchen and washer and dryer stay! Newer hot water tank. Laundry has a built-in cabinet -could be storage or pantry. Seller is leaving large storage shed. Hardwood under carpets. Own for less than rent. HOME BEING SOLD AS-IS!!
Key facts
- 9,484 sq ft lot
- Garage
- Built 1950
Property features AI
Finance
- Other: Above-grade finished living area recorded from public records
Exterior
- Parking: Attached garage with garage door opener (1-car)
- Security: Security system
- Utilities: Public water; Public sewer
- Home design: Single-family residence; Ranch floor plan; Attached property
- Construction: Vinyl siding; Composition roof; Crawl space foundation; Home age: approximately 76–100 years
- Exterior features: Metal fencing; Shed(s)
Interior
- Kitchen: Electric range; Microwave; Disposal; Refrigerator
- Bedrooms: 3 bedrooms, all on the first floor
- Flooring: Carpet in living areas and bedrooms; Linoleum in kitchen and bathroom
- Bathrooms: 1 full bathroom
- Heating & cooling: Forced air heating; Electric cooling (central)
- Interior features: Ceiling fan(s); Eat-in kitchen; Security system
- Laundry & utility: Laundry room off the kitchen; Dryer; Built-in features in laundry
Neighborhood map
What this means for you Summary
Snapshot
- This is a 3-bed/1.0-bath single-family listed at $125k.
Deal economics
- At list price, monthly cash flow is $337 ($4k/yr) — positive.
- The deal already cash-flows at list — no discount required.
- Meets the 1% rule at list price ($1k rent vs $125k).
- Cap rate 9.5% vs local median 3.9% in Kansas City — top-decile yield for the area; either an underpriced asset or a hidden risk that comps aren't pricing in. Stress-test before assuming the spread holds.
Location & tenants
- Location reads 78/100 on livability (#28 in MO, #2,671 nationally) — a middle-class / working-renter tenant base. Strengths: amenities A+, commute A+, cost of living A+; Watch: crime F.
- Raytown C-2 (suburban): math 12% / reading 28% proficiency, ranked #302 of 324 in MO (top 93%) — low school quality limits family demand, transient renter base, plan for 1-2y turnover.
- Zoned schools: Eastwood Hills Elem. (math 8% / reading 22%, grade F, #982 of 1,115 statewide, top 89%, 329 students, 82% FRL); Raytown Sr. High (math 7% / reading 29%, grade F, #482 of 521 statewide, top 92%, 1,365 students, 65% FRL) — zoned schools average 74% FRL vs 54% district-wide (20 pts higher); higher-poverty schools than district average — tighter screening recommended.
- Market conditions: 52 active listings in the ZIP; 11 comparable units currently listed for rent nearby; rentals at typical pace (median 21d on market — plan ~3-4 weeks tenant-placement turnaround); 4,002 units permitted in Jackson County in 2024 (2,271 in 5+ unit buildings).
- This rent runs 34% of the median local income ($51k/yr) — at the standard rent-burdened threshold; future hikes will face affordability resistance.
Forward outlook
- Local home prices are declining (-3.0%/yr); year-one equity from $864 of loan paydown is wiped out by about $4k of value loss. Plan a longer hold.
- Jackson County population projected at +4% by 2050 — modest demand growth; plan on rents tracking national, not racing it.
- At projected returns (-3.0% appreciation + 3.0% rent growth), your $35k cash investment doubles in ~10 years — after that, you're playing with house money.
Negotiation context
- Only 4 days on market — expect competitive offers; lowballing is unlikely to land.
- 4 sale attempts since 11y ago with the ask held roughly flat each time — persistent listings suggest the price (not the market) is what's stuck; bring a comps-based counter.
Risks & watch-outs
- Watch-outs: built in 1950 — expect roof / HVAC / electrical / plumbing capex.
Questions for the listing agent
- Built in 1950 — when were the roof, HVAC, electrical panel, plumbing, and water heater last replaced?
- Is there a deadline driving the sale (1031 exchange, divorce, estate, relocation)? That informs how much negotiation room exists.
- Crime grade is F in this area — have there been break-ins, vandalism, or insurance claims at this property in the last 3 years? What carrier currently insures it and at what premium?
- What's the average days-on-market for RENTAL listings here right now (not sales)? A rising rental-DOM trend means longer vacancies and softer asking-rent achievability than the comps imply.
- What's the recent tenant-quality profile in this submarket — average credit score on applications, eviction rate, late-payment / NSF rate, and stable-employment percentage? A property-management company in the area should have these aggregated.
- How much new for-sale + rental construction is in the pipeline within 1–3 miles? Heavy new supply typically softens prices + rents 12–24 months out; constrained supply supports both.
Investment metrics
- 1% rule
- 1.15% ✓
- Cap rate
- 9.53%
- Cash-on-cash
- 11.55%
- DSCR
- 1.51
- GRM
- 7.2
CMA / ARV
- ARV (on-the-fly)
- $157,750
- Comps found
- 12
Show comp detail 12 sales within ~0.75 mi
| Address | Dist | Beds/Ba | Sqft | Sold | Price | $/sf | Match |
|---|---|---|---|---|---|---|---|
| 7723 Sni-a-bar Rd | 0.00mi | 3/1.0 | 1,262 (0%) | 1mo | $125,000 | $99 | 99 |
| 5118 Rinker Rd | 0.28mi | 3/2.0 | 1,224 (-3%) | 3mo | $189,000 | $154 | 75 |
| 7815 E 51st St | 0.10mi | 4/1.0 (+1) | 1,128 (-11%) | 1mo | $134,900 | $120 | 72 |
| 8409 E 47th Ter | 0.44mi | 3/1.0 | 1,200 (-5%) | 1mo | $189,900 | $158 | 70 |
| 7725 E 51st St | 0.15mi | 3/1.0 | 1,128 (-11%) | 10mo | $134,900 | $120 | 67 |
| 7605 Sni A Bar Ter | 0.22mi | 3/1.0 | 1,112 (-12%) | 7mo | $180,000 | $162 | 64 |
| 4748 Eastern Ave | 0.52mi | 2/1.0 (-1) | 1,204 (-5%) | 8mo | $79,000 | $66 | 56 |
| 7504 E 49th St | 0.35mi | 3/2.0 | 1,152 (-9%) | 12mo | $110,000 | $95 | 55 |
| 7406 E 51st St | 0.34mi | 4/2.0 (+1) | 1,344 (+6%) | 13mo | $190,000 | $141 | 53 |
| 6876 Sni A Bar Rd | 0.73mi | 3/1.5 | 1,160 (-8%) | 1mo | $145,000 | $125 | 50 |
| 8604 E 47th St | 0.63mi | 3/2.0 | 1,360 (+8%) | 9mo | $160,000 | $118 | 46 |
| 5412 Sycamore Ave | 0.45mi | 3/1.5 | 1,440 (+14%) | 12mo | $215,000 | $149 | 43 |
Match score weights: distance 35% · size 25% · config 20% · recency 20%. Top-matched comps best support the ARV.
Projected returns pro-forma
-3.0% appreciation · 3.0% rent growth · sell at horizon
- IRR
- 0.9%
- Equity multiple
- 1.03×
- Total profit
- $1,181
- Equity at exit
- $18,638
- IRR
- 10.5%
- Equity multiple
- 1.82×
- Total profit
- $28,584
- Equity at exit
- $10,808
Cash invested: $35,000 (down + closing). Projections, not guarantees.
Landlord ↔ Tenant lean methodology
- Overall (STATE)
- 81 Strongly Landlord-Friendly
- State Missouri
- 81 Strongly Landlord-Friendly · R+10
- County
- — inherits STATE
- City
- — inherits STATE
ZIP-level market 64129
- Home prices YoY
- -9.8%
- Active inventory
- 52
- Price-to-rent
- 7.2×
Monthly cashflow live
- Estimated rent
- $1,440 high interval (Pro) →
- Mortgage (P&I)
- −$656
- Tax from tax record
- −$93 /mo · $1,117/yr
- Insurance
- −$52
- HOA
- −$0
- Vacancy / Maint / Mgmt
- −$302
- Net cashflow
- $337
Break-even live
UW: 25.0% down · 7.5% · 30yr · 1.5% tax · 5.0% vac · 8.0% maint · 8.0% mgmt
Financing live
Cash to close
- Down payment
- $31,250
- Closing costs
- $3,750
- Reserves months
- —
- Total cash needed
- —
Loan-product check · same deal, 3 products live
Conventional
25% down · 7.5% · 30yr
- Down + closing
- —
- Monthly P&I
- —
- Monthly cashflow
- —
- DSCR
- —
- Eligible?
- —
Personal DTI + credit; lowest rate.
DSCR
20% down · 8.5% · 30yr
- Down + closing
- —
- Monthly P&I
- —
- Monthly cashflow
- —
- DSCR
- —
- Eligible?
- —
No personal income docs; deal must DSCR.
Hard money
10% down · 12.0% · 12mo
- Down + closing
- —
- Monthly P&I
- —
- Monthly cashflow
- —
- DSCR
- —
- Eligible?
- —
Short-term bridge; refi at stabilization.
Rent comps 11 comps
| Address | Beds | Baths | Sqft | Rent | $/sqft | DOM | Units | Dist |
|---|---|---|---|---|---|---|---|---|
| 7707 E 50th Ter Kansas City, MO | 4.0 | 2.0 | 1250 | $1,250 | $1.00 | 21d | 1 | 0.16mi |
| 7615 E 49th St Kansas City, MO | 2.0 | 1.0 | 888 | $1,095 | $1.23 | 43d | 1 | 0.27mi |
| 5126 Booth Ave Kansas City, MO | 2.0 | 1.0 | 950 | $1,149 | $1.21 | 12d | 1 | 0.37mi |
| 8648 E 52nd Ter Kansas City, MO | 3.0 | 1.5 | 1224 | $1,395 | $1.14 | 23d | 1 | 0.57mi |
| 5312 Hunter St Raytown, MO | 3.0 | 1.5 | 912 | $1,450 | $1.59 | 2d | 1 | 0.84mi |
| 5312 Hunter St Raytown, MO | 3.0 | 1.5 | 912 | $1,450 | $1.59 | 3d | 1 | 0.84mi |
| 5004 Glenside Dr Kansas City, MO | 4.0 | 1.5 | 1685 | $1,756 | $1.04 | 43d | 1 | 0.95mi |
| 8818 E 58 Ter Raytown, MO | 3.0 | 1.5 | 1700 | $1,897 | $1.12 | 12d | 1 | 1.16mi |
| 6017 Farley Ave Raytown, MO | 2.0 | 2.5 | 1152 | $1,495 | $1.30 | 43d | 1 | 1.42mi |
| 5035 Overton Ave Kansas City, MO | 3.0 | 2.0 | 1323 | $1,795 | $1.36 | 43d | 1 | 1.47mi |
| 4837 Overton Ave Kansas City, MO | 3.0 | 1.5 | 1344 | $1,611 | $1.20 | 21d | 1 | 1.48mi |
Listing history 11 events
-
2026-05-06status Pending
-
2026-05-03status Active
-
2026-04-19status Pending
-
2026-04-17$125,000 Active
-
2026-04-12historical $125,000
-
2015-10-27soldstatus
-
2015-10-26soldstatus 506-char remark
Show marketing remark (506 chars)
Super Cute Ranch!!! Would be great for an investor or first time homeowner! Kansas city address with Raytown Schools. Vinyl siding for low maintenance. Nice lot with fenced back yard. Large living room with additional family room added on the back with fireplace. Laundry off the kitchen and washer and dryer stay! Newer hot water tank. Laundry has a built-in cabinet -could be storage or pantry. Seller is leaving large storage shed. Hardwood under carpets. Own for less than rent. HOME BEING SOLD AS-IS!!
-
2015-08-10$37,900 506-char remark
Show marketing remark (506 chars)
Super Cute Ranch!!! Would be great for an investor or first time homeowner! Kansas city address with Raytown Schools. Vinyl siding for low maintenance. Nice lot with fenced back yard. Large living room with additional family room added on the back with fireplace. Laundry off the kitchen and washer and dryer stay! Newer hot water tank. Laundry has a built-in cabinet -could be storage or pantry. Seller is leaving large storage shed. Hardwood under carpets. Own for less than rent. HOME BEING SOLD AS-IS!!
-
2015-08-10historical
Show marketing remark (506 chars)
Super Cute Ranch!!! Would be great for an investor or first time homeowner! Kansas city address with Raytown Schools. Vinyl siding for low maintenance. Nice lot with fenced back yard. Large living room with additional family room added on the back with fireplace. Laundry off the kitchen and washer and dryer stay! Newer hot water tank. Laundry has a built-in cabinet -could be storage or pantry. Seller is leaving large storage shed. Hardwood under carpets. Own for less than rent. HOME BEING SOLD AS-IS!!
-
2015-05-28$50,000
-
1982-04-01soldstatus
ⓘ Source: listings_history table (triggers on properties + properties_extension) + one-shot
backfill from property_details.listing_events for pre-trigger history.
Tax reassessment forecast MO · Resets to sale price
- Current annual tax
- $1,117 · $93/mo
- Projected year-2 tax
- $1,212 · $101/mo
- Expected delta
- +$96/yr (+$8/mo · 8.6%)
ⓘ Screening estimate from a state-policy table — verify with the county assessor before closing.
Climate risk First Street
- Flood 1/10 Low FEMA zone X (unshaded) · 0% chance over 30 yrs
- Wildfire 1/10 Low
- Heat 4/10 Moderate 7 d/yr ≥107°F today · 16 d/yr by 30 yrs out
- Wind 2/10 Low
- Air quality 3/10 Moderate 3 unhealthy d/yr today · 5 by 30 yrs out
Nearby sold comps map
Loading sold comps map…
Walkable amenities ~0.75 mi
Loading nearby amenities…
Taxation est. · year 1
- Rental income
- $17,279
- − Mortgage interest
- −$7,002
- − Property taxes
- −$1,117
- − Insurance
- −$625
- − Repairs & maintenance
- −$1,382
- − Management
- −$1,382
- − Depreciation
- −$3,636
- Taxable income
- $2,134
- Est. tax owed @ 24.0%
- −$512
- After-tax cash flow
- $3,530/yr
For passive investors: Depreciation is non-cash, so a rental often shows a tax loss while cash-flowing — sheltering income. Rental losses are passive: they offset passive income freely, and up to $25,000/yr can offset ordinary (W-2) income if you actively participate and your MAGI is under $100k (phasing out to $0 by $150k); unused losses carry forward. On sale, claimed depreciation is recaptured at up to 25%, and gains may owe capital-gains tax (a 1031 exchange can defer both). Figures are a year-1 estimate at your 24.0% rate — not tax advice; consult a CPA.
Schools (NCES district)
- District
- Raytown C-2
- NCES district ID
- 2926070
- Math proficiency
- 12% ▼ -11.00%
- Reading proficiency
- 28% ▼ -9.00%
- Median HH income
- $47,215
- Composite
- 17.59/100
- National rank
- #9039
- State rank
- #302 of 324 in MO
Livability — Kansas City
- Score
- 78/100
- State rank
- #28
- US rank
- #2671
Category grades
Schools grade is shown separately in the Schools card above.
Census & demographics
- Census place
- Kansas City, MO
- County
- Jackson County · 687,798 people
- City population
- 439,467
- Metro
- Kansas City, MO-KS
- Population (ZIP)
- 9,267
- Household income
- $51,310
- Rent vs Own
- Severe rent burden
- 349.0
Population outlook (Jackson County) Hauer SSP2
- Today (2025)
- 719,589 people
- By 2030
- 731,456 · +1.6%
- By 2040
- 746,689 · +3.8%
- By 2050
- 749,289 · +4.1%
- By 2075
- 736,227 · +2.3%
- By 2100
- 668,210 · -7.1%
Race, ethnicity, and origin ACS 2023
- Neighborhood character
- Diverse neighborhood (Simpson 0.65)
- Race & ethnicity
- Black 45% White 37% Hispanic / Latino 11% Two or more races 9%
- Hispanic origin (detail)
- Mexican 6%
- Common ancestry
- Lithuanian 4% Italian 2% Armenian 1%
- Foreign-born
- 8% · Canada
- Languages at home
- 87% English-only · Spanish 8% Arabic 1%
Political lean MEDSL · Jackson
- 2024 margin
- D (+19.3) · D 58.9% · R 39.5% · Other 1.6%
- 2008→2024 swing
- -6.1pp toward R · 2008: 25.4pp · 2024: 19.3pp
- All cycles
- 2024: D+19.3 2020: D+22.0 2016: D+16.6 2012: D+19.0 2008: D+25.4
Not yet ingested
- Civics
- —
Market trends
- HPI YoY
- ▼ -32.25%
- Current HPI
- 297.5233
- Rent YoY
- —
- Metro
- Kansas City, MO-KS
- State GDP YoY
- ▲ 1.84%
- F500 in state
- 20
Industry mix (Fortune 500 HQ in MO)
| Industry | F500 HQs | Revenue |
|---|---|---|
| Healthcare | 1 | $163B |
|
||
| Insurance | 1 | $21B |
|
||
| Industrial Technology | 1 | $17B |
|
||
| Retail | 1 | $16B |
|
||
| Industrial Distribution | 1 | $10B |
|
||
| Utilities | 1 | $9B |
|
||
Price history
+150.0% since first listed11 events — show timeline
- 2026-05-06 Pending — Heartland MLS as Distributed by MLS Grid
- 2026-05-03 Relisted — Heartland MLS as Distributed by MLS Grid
- 2026-04-19 Pending — Heartland MLS as Distributed by MLS Grid
- 2026-04-17 Listed $125,000 Heartland MLS as Distributed by MLS Grid
- 2026-04-12 Coming Soon $125,000 Heartland MLS as Distributed by MLS Grid
- 2015-10-27 Sold (Public Records) — Public Records
- 2015-10-26 Sold (MLS) — Heartland MLS as Distributed by MLS Grid
- 2015-08-10 Listing Removed — Heartland MLS as Distributed by MLS Grid
- 2015-08-10 Listed $37,900 Heartland MLS as Distributed by MLS Grid
- 2015-05-28 Listed $50,000 Heartland MLS as Distributed by MLS Grid
- 1982-04-01 Sold (Public Records) — Public Records
Property tax history
+2.9%/yrLatest (2025): $1,117 · -32.0% YoY. Source: county tax records.
Cash-flow waterfall
monthlySold comps — $/sqft
last 12 mo · ≤1 miLoading sold comps…